South Wales Central (Senedd Cymru electoral region)
South Wales Central is an electoral region of the Senedd, consisting of eight constituencies. The region elects 12 members, eight directly elected constituency members and four additional members. The electoral region was first used in 1999, when the Assembly for Wales was created.
| Senedd electoral region | |
|---|---|
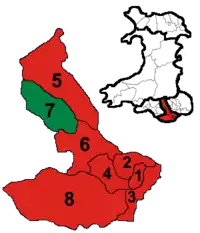 | |
| South Wales Central shown within Wales | |
| Created 1999 | |
| Current representation | |
| Labour | 7 MSs |
| Conservative | 2 MSs |
| Plaid Cymru | 1 MS |
| Abolish the Welsh Assembly Party | 1 MS |
| Welsh National Party | 1 MS |
| Constituencies 1. Cardiff Central 2. Cardiff North 3. Cardiff South and Penarth 4. Cardiff West 5. Cynon Valley 6. Pontypridd 7. Rhondda 8. Vale of Glamorgan | |
| Preserved counties Mid Glamorgan (part) South Glamorgan (part) | |
Each constituency elects one Member of the Senedd by the first past the post electoral system, and the region as a whole elects four additional or top-up Assembly Members, to create a degree of proportional representation. The additional member seats are allocated from closed lists by the D'Hondt method, with constituency results reckoned as pre elected list members.
County boundaries
The region covers much of the preserved county of Mid Glamorgan and much of the preserved county of South Glamorgan. The rest of Mid Glamorgan is partly within the South Wales East electoral region and partly within the South Wales West. The rest of South Glamorgan is within the South Wales West electoral region.
Electoral region profile
The region is predominantly urban, taking in Wales' capital and largest city, Cardiff, as well as the working-class former mining town of Pontypridd, the seaside resort of Barry, and parts of the formerly industrial and still heavily populated South Wales Valleys. However, the region also includes rural areas in the western part of the Vale of Glamorgan.
Constituencies
The eight constituencies have the names and boundaries of constituencies of the House of Commons of the Parliament of the United Kingdom (Westminster):
| Constituency | 2016 Result | Preserved counties | |
|---|---|---|---|
| Cardiff Central | Jenny Rathbone Labour |
Entirely within South Glamorgan | |
| Cardiff North | Julie Morgan Labour |
Entirely within South Glamorgan | |
| Cardiff South and Penarth | Vaughan Gething Labour |
Entirely within South Glamorgan | |
| Cardiff West | Mark Drakeford Labour |
Entirely within South Glamorgan | |
| Cynon Valley | Vikki Howells Labour & Co-operative |
Entirely within Mid Glamorgan | |
| Pontypridd | Mick Antoniw Labour |
Partly Mid Glamorgan, partly South Glamorgan | |
| Rhondda | Leanne Wood Plaid Cymru |
Entirely within Mid Glamorgan | |
| Vale of Glamorgan | Jane Hutt Labour |
Partly Mid Glamorgan, partly South Glamorgan | |
Assembly members and Members of the Senedd
Constituency AMs
Regional list AMs and MSs
N.B. This table is for presentation purposes only
| Term | Election | AM / MS | AM / MS | AM / MS | AM / MS | ||||
|---|---|---|---|---|---|---|---|---|---|
| 1st | 1999 | Jonathan Morgan (Con) |
David Melding (Con) |
Owen John Thomas (PC) |
Pauline Jarman (PC) | ||||
| 2nd | 2003 | Leanne Wood (PC) | |||||||
| 3rd | 2007 | Andrew R. T. Davies (Con) |
Chris Franks (PC) | ||||||
| 4th | 2011 | Eluned Parrott (LD) | |||||||
| 5th | 2016 | Gareth Bennett (UKIP) later Independent then AWAP |
Neil McEvoy (PC) later Independent then WNP Now - PROPEL | ||||||
| 2018 | |||||||||
| 2020 | |||||||||
2016 Welsh Assembly election additional members
| Party | Constituency Seats | List Votes (vote %) [1] | D'Hondt Entitlement | Additional Members Elected | Total Members Elected | Deviation from D'Hondt Entitlement | |
|---|---|---|---|---|---|---|---|
| Labour | 7 | 78,366 (34%) | 5 | 0 | 7 | +2 | |
| Plaid Cymru | 1 | 48,357 (21%) | 3 | 1 | 2 | -1 | |
| Conservative | 0 | 42,185 (18%) | 3 | 2 | 2 | -1 | |
| UKIP | 0 | 23,958 (10%) | 1 | 1 | 1 | 0 | |
| Liberal Democrats | 0 | 14,875 (6%) | 0 | 0 | 0 | 0 | |
| Abolish the Welsh Assembly | 0 | 9,163 (4%) | 0 | 0 | 0 | 0 | |
| Green | 0 | 7,949 (3%) | 0 | 0 | 0 | 0 | |
| Women's Equality | 0 | 2,807 (1%) | 0 | 0 | 0 | 0 | |
| Monster Raving Loony | 0 | 1,096 (0%) | 0 | 0 | 0 | 0 | |
| TUSC | 0 | 736 (0%) | 0 | 0 | 0 | 0 | |
| Communist | 0 | 520 (0%) | 0 | 0 | 0 | 0 | |
| Freedom to Choose | 0 | 470 (0.2%) | 0 | 0 | 0 | 0 | |
Regional AMs Elected 2016
| Party | Name | |
|---|---|---|
| Conservative | Andrew R. T. Davies | |
| Conservative | David Melding | |
| Plaid Cymru | Neil McEvoy | |
| UKIP | Gareth Bennett | |
2011 Welsh Assembly election additional members
| Party | Constituency Seats | List Votes (vote %) | D'Hondt Entitlement | Additional Members Elected | Total Members Elected | Deviation from D'Hondt Entitlement | |
|---|---|---|---|---|---|---|---|
| Labour | 8 | 85,445 (41.0%) | 6 | 0 | 8 | +2 | |
| Conservative | 0 | 45,751 (22.0%) | 3 | 2 | 2 | −1 | |
| Plaid Cymru | 0 | 28,606 (13.7%) | 2 | 1 | 1 | −1 | |
| Liberal Democrats | 0 | 16,514 (7.9%) | 1 | 1 | 1 | 0 | |
| Green | 0 | 10,774 (5.2%) | 0 | 0 | 0 | 0 | |
| UKIP | 0 | 8,292 (4.0%) | 0 | 0 | 0 | 0 | |
| Socialist Labour | 0 | 4,690 (2.3%) | 0 | 0 | 0 | 0 | |
| BNP | 0 | 3,805 (1.8%) | 0 | 0 | 0 | 0 | |
| Welsh Christian | 0 | 1,873 (0.9%) | 0 | 0 | 0 | 0 | |
| Monster Raving Loony | 0 | 1,237 (0.6%) | 0 | 0 | 0 | 0 | |
| TUSC | 0 | 830 (0.4%) | 0 | 0 | 0 | 0 | |
| Communist | 0 | 516 (0.2%) | 0 | 0 | 0 | 0 | |
Regional AMs elected 2011
| Party | Name | |
|---|---|---|
| Conservative | Andrew R. T. Davies | |
| Conservative | David Melding | |
| Liberal Democrats | Eluned Parrott † | |
| Plaid Cymru | Leanne Wood | |
† Replaced John Dixon, who was disqualified for being a member of a public body to which AMs cannot belong.[2]
2007 Welsh Assembly election additional members [3]
| Party | Constituency Seats | List Votes (vote %) | D'Hondt Entitlement | Additional Members Elected | Total Members Elected | Deviation from D'Hondt Entitlement | |
|---|---|---|---|---|---|---|---|
| Labour | 6 | 70,799 (34.0%) | 5 | 0 | 6 | +1 | |
| Conservative | 1 | 45,127 (21.7%) | 3 | 2 | 3 | 0 | |
| Plaid Cymru | 0 | 32,207 (15.5%) | 2 | 2 | 2 | 0 | |
| Liberal Democrats | 1 | 29,626 (14.0%) | 2 | 0 | 1 | −1 | |
| BNP | 0 | 7,889 (3.8%) | 0 | 0 | 0 | 0 | |
| Green | 0 | 7,831 (3.8%) | 0 | 0 | 0 | 0 | |
| UKIP | 0 | 7,645 (3.7%) | 0 | 0 | 0 | 0 | |
| Welsh Christian | 0 | 1,987 (1.0%) | 0 | 0 | 0 | 0 | |
| Socialist Labour | 0 | 1,744 (0.8%) | 0 | 0 | 0 | 0 | |
| Respect | 0 | 1,079 (0.5%) | 0 | 0 | 0 | 0 | |
| Socialist Alternative | 0 | 838 (0.4%) | 0 | 0 | 0 | 0 | |
| Communist | 0 | 817 (0.4%) | 0 | 0 | 0 | 0 | |
| CPA | 0 | 757 (0.4%) | 0 | 0 | 0 | 0 | |
| Socialist Equality | 0 | 292 (0.1%) | 0 | 0 | 0 | 0 | |
2003 Welsh Assembly election additional members[4]
| Party | Constituency Seats | List Votes (vote %) | D'Hondt Entitlement | Additional Members Elected | Total Members Elected | Deviation from D'Hondt Entitlement | |
|---|---|---|---|---|---|---|---|
| Labour | 7 | 74,369 (41.08%) | 7 | 0 | 7 | 0 | |
| Conservative | 0 | 33,404 (18.45%) | 2 | 2 | 2 | 0 | |
| Plaid Cymru | 0 | 27,956 (15.44%) | 2 | 2 | 2 | 0 | |
| Liberal Democrats | 1 | 24,926 (13.77%) | 1 | 0 | 1 | 0 | |
| UKIP | 0 | 6,920 (3.82.%) | 0 | 0 | 0 | 0 | |
| Green | 0 | 6,047 (3.34%) | 0 | 0 | 0 | 0 | |
| Socialist Labour | 0 | 3,217 (1.78%) | 0 | 0 | 0 | 0 | |
| New Millennium Bean Party | 0 | 1,027 (0.57%) | 0 | 0 | 0 | 0 | |
| Cymru Annibynnol | 0 | 1,018 (0.56%) | 0 | 0 | 0 | 0 | |
| Vote 2 Stop the War | 0 | 1,013 (0.56%) | 0 | 0 | 0 | 0 | |
| Communist | 0 | 577 (0.32%) | 0 | 0 | 0 | 0 | |
| ProLife Alliance | 0 | 573 (0.32%) | 0 | 0 | 0 | 0 | |
1999 Welsh Assembly election additional members[4]
| Party | Constituency Seats | List Votes (vote %) | D'Hondt Entitlement | Additional Members Elected | Total Members Elected | Deviation from D'Hondt Entitlement | |
|---|---|---|---|---|---|---|---|
| Labour | 6 | 79,564 (36.92%) | 5 | 0 | 6 | +1 | |
| Plaid Cymru | 1 | 58,080 (26.95%) | 3 | 2 | 3 | 0 | |
| Conservative | 0 | 34,944 (16.22%) | 2 | 2 | 2 | 0 | |
| Liberal Democrats | 1 | 30,911 (14.35%) | 2 | 0 | 1 | −1 | |
| Green | 0 | 5,336 (2.48%) | 0 | 0 | 0 | 0 | |
| Socialist Labour | 0 | 2,822 (1.31%) | 0 | 0 | 0 | 0 | |
| Independent- Matt | 0 | 1,524 (0.71%) | 0 | 0 | 0 | 0 | |
| Natural Law | 0 | 665 (0.31%) | 0 | 0 | 0 | 0 | |
| Communist | 0 | 652 (0.30%) | 0 | 0 | 0 | 0 | |
| Socialist Alliance | 0 | 602 (0.28%) | 0 | 0 | 0 | 0 | |
| Independent- Phillips | 0 | 378 (0.18%) | 0 | 0 | 0 | 0 | |
Notes
- "Election results for South Wales Central, 5 May 2016". cardiff.moderngov.co.uk. May 5, 2016.
- Davies, Daniel (July 5, 2011). "No return for disqualified Dixon" – via www.bbc.co.uk.
- BBC Election results
- http://www.politicsresources.net/area/uk/ass/constit/wr3.htm