South Wales West (Senedd Cymru electoral region)
South Wales West is an electoral region of the Senedd, consisting of seven constituencies. The region elects 11 members, seven directly elected constituency members and four additional members. The electoral region was first used in 1999, when the Assembly for Wales was created.
| Senedd electoral region | |
|---|---|
 | |
| Created 1999 | |
| Current representation | |
| Labour | 7 MSs |
| Plaid Cymru | 2 MSs |
| Conservative | 1 MS |
| Independent | 1 MS |
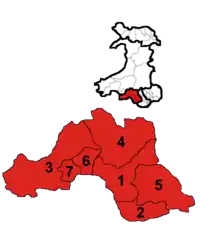
| Constituencies 1. Aberavon 2. Bridgend 3. Gower 4. Neath 5. Ogmore 6. Swansea East 7. Swansea West | |
| Preserved counties Mid Glamorgan (part) South Glamorgan (part) West Glamorgan | |
Each constituency elects one Member of the Senedd by the first past the post electoral system, and the region as a whole elects four additional or top-up Members of the Senedd, to create a degree of proportional representation. The additional member seats are allocated from closed lists by the D'Hondt method, with constituency results being taken into account in the allocation.
County boundaries
The region covers the whole of the preserved county of West Glamorgan, part of the preserved county of Mid Glamorgan and part of the preserved county of South Glamorgan. The rest of Mid Glamorgan is divided between the South Wales Central and South Wales East electoral regions. The rest of South Glamorgan is within the South Wales Central region.
Electoral region profile
The region is predominantly urban, taking in Wales' second largest city, Swansea, as well as working-class towns such as Neath and Port Talbot. However there are also rural regions, such as on the Gower peninsula. A higher proportion of the local populace are Welsh speakers than in the neighbouring region, South Wales Central.
Constituencies
The seven constituencies have the names and boundaries of constituencies of the House of Commons of the Parliament of the United Kingdom (Westminster):
| Constituency[nb 1] | Electorate | Majority[nb 2] | Assembly member | Nearest opposition | Preserved counties | ||
|---|---|---|---|---|---|---|---|
| Aberavon | 49,891 | 6,402 (30.7%) | David Rees | Bethan Jenkins | Entirely within West Glamorgan | ||
| Bridgend | 62,185 | 5,623 (20.9%) | Carwyn Jones | George Jabbour | Partly Mid Glamorgan, partly South Glamorgan | ||
| Gower | 62,163 | 1,829 (6.1%) | Rebecca Evans | Lyndon Jones | Entirely within West Glamorgan | ||
| Neath | 55,859 | 2,923 (11.5%) | Jeremy Miles | Alun Lluwellyn | Entirely within West Glamorgan | ||
| Ogmore | 56,661 | 9,468 (40.5%) | Huw Irranca-Davies | Tim Thomas | Partly Mid Glamorgan, partly South Glamorgan | ||
| Swansea East | 58,521 | 7,452 (36.2%) | Mike Hedges | Clifford Johnson | Entirely within West Glamorgan | ||
| Swansea West | 56,892 | 5,080 (22.9%) | Julie James | Craig Lawton | Entirely within West Glamorgan | ||
Assembly members and Members of the Senedd
Constituency AMs and MSs
| Term | Election | Aberavon | Bridgend | Gower | Neath | Ogmore | Swansea East | Swansea West | |||||||
|---|---|---|---|---|---|---|---|---|---|---|---|---|---|---|---|
| 1st | 1999 | Brian Gibbons (Lab) |
Carwyn Jones (Lab) |
Edwina Hart (Lab) |
Gwenda Thomas (Lab) |
Janice Gregory (Lab) |
Val Feld (Lab) |
Andrew Davies (Lab) | |||||||
| 2001 | Val Lloyd (Lab) | ||||||||||||||
| 2nd | 2003 | ||||||||||||||
| 3rd | 2007 | ||||||||||||||
| 4th | 2011 | David Rees (Lab) |
Mike Hedges (Lab) |
Julie James (Lab) | |||||||||||
| 5th | 2016 | Rebecca Evans (Lab) |
Jeremy Miles (Lab) |
Huw Irranca-Davies (Lab) | |||||||||||
Regional list AMs and MSs
N.B. This table is for presentation purposes only
| Term | Election | AM / MS | AM / MS | AM / MS | AM / MS | ||||
|---|---|---|---|---|---|---|---|---|---|
| 1st | 1999 | Alun Cairns (Con) |
Dai Lloyd (PC) |
Janet Davies (PC) |
Peter Black (LD) | ||||
| 2nd | 2003 | ||||||||
| 3rd | 2007 | Bethan Jenkins (PC) | |||||||
| 4th | 2011 | Suzy Davies (Con) |
Byron Davies (Con) | ||||||
| 2015[nb 3] | Altaf Hussain (Con) | ||||||||
| 5th | 2016 | Dai Lloyd (PC) |
Caroline Jones (UKIP) (later Ind, BREX currently Ind) | ||||||
| 2018 | |||||||||
| 2019 | |||||||||
| 2020 | |||||||||
2016 Welsh Assembly election additional members
In the 2016 National Assembly for Wales election, the results for additional members were as follows:[1]
| Party | Constituency Seats | List Votes (vote %) | D'Hondt Entitlement | Additional Members Elected | Total Members Elected | Deviation from D'Hondt Entitlement | |
|---|---|---|---|---|---|---|---|
| Labour | 7 | 66,903 (39.5%) | 5 | 0 | 7 | +2 | |
| Plaid Cymru | 0 | 29,050 (17.2%) | 2 | 2 | 2 | 0 | |
| Conservative | 0 | 25,414 (15.0%) | 2 | 1 | 1 | -1 | |
| UKIP | 0 | 23.096 (13.7%) | 2 | 1 | 1 | -1 | |
| Liberal Democrats | 0 | 10,946 (6.5%) | 0 | 0 | 0 | 0 | |
| Abolish the Welsh Assembly Party | 0 | 7,137 (4%) | 0 | 0 | 0 | 0 | |
| Green Party of England and Wales | 0 | 4,420 (3%) | 0 | 0 | 0 | 0 | |
| Official Monster Raving Loony Party | 0 | 1,106 (1%) | 0 | 0 | 0 | 0 | |
| Trade Unionist and Socialist Coalition | 0 | 686 (0%) | 0 | 0 | 0 | 0 | |
| Welsh Communist Party | 0 | 431 (0%) | 0 | 0 | 0 | 0 | |
Regional AMs elected 2016
| Party | Name | |
|---|---|---|
| Plaid Cymru | Bethan Jenkins | |
| Plaid Cymru | David Lloyd | |
| Conservative | Suzy Davies | |
| UKIP | Caroline Jones | |
2011 Welsh Assembly election additional members
In the 2011 National Assembly for Wales election, the results for additional members were as follows:
| Party | Constituency Seats | List Votes (vote %) | D'Hondt Entitlement | Additional Members Elected | Total Members Elected | Deviation from D'Hondt Entitlement | |
|---|---|---|---|---|---|---|---|
| Labour | 7 | 71,766 (46.5%) | 6 | 0 | 7 | +1 | |
| Conservative | 0 | 27,457 (17.8%) | 2 | 2 | 2 | 0 | |
| Plaid Cymru | 0 | 21,258 (13.8%) | 2 | 1 | 1 | −1 | |
| Liberal Democrats | 0 | 10,683 (6.9%) | 1 | 1 | 1 | 0 | |
| UKIP | 0 | 6,619 (4.3%) | 0 | 0 | 0 | 0 | |
| Socialist Labour | 0 | 5,057 (3.3%) | 0 | 0 | 0 | 0 | |
| BNP | 0 | 4,714 (3.1%) | 0 | 0 | 0 | 0 | |
| Green | 0 | 3,952 (2.6%) | 0 | 0 | 0 | 0 | |
| Welsh Christian | 0 | 1,602 (1.0%) | 0 | 0 | 0 | 0 | |
| TUSC | 0 | 809 (0.5%) | 0 | 0 | 0 | 0 | |
| Communist | 0 | 464 (0.3%) | 0 | 0 | 0 | 0 | |
Regional AMs elected 2011
| Party | Name | |
|---|---|---|
| Conservative | Byron Davies † | |
| Conservative | Suzy Davies | |
| Liberal Democrats | Peter Black | |
| Plaid Cymru | Bethan Jenkins | |
† Resigned as AM following his election to the UK House of Commons on 7 May 2015; replaced by Altaf Hussain from 19 May 2015.
2007 Welsh Assembly election additional members
In the election for additional members in the 2007 National Assembly for Wales election, the results were as follows:[2]
| Party | Constituency Seats | List Votes (vote %) | D'Hondt Entitlement | Additional Members Elected | Total Members Elected | Deviation from D'Hondt Entitlement | |
|---|---|---|---|---|---|---|---|
| Labour | 7 | 58,374 (35.8%) | 6 | 0 | 7 | +1 | |
| Plaid Cymru | 0 | 28,819 (17.7%) | 2 | 2 | 2 | 0 | |
| Conservative | 0 | 26,119 (16.1%) | 2 | 1 | 1 | −1 | |
| Liberal Democrats | 0 | 20,226 (12.4%) | 1 | 1 | 1 | 0 | |
| BNP | 0 | 8,993 (5.5%) | 0 | 0 | 0 | 0 | |
| Green | 0 | 6,130 (3.8%) | 0 | 0 | 0 | 0 | |
| UKIP | 0 | 5,914 (3.6%) | 0 | 0 | 0 | 0 | |
| Socialist Labour | 0 | 2,367 (1.5%) | 0 | 0 | 0 | 0 | |
| Welsh Christian | 0 | 1,685 (1.0%) | 0 | 0 | 0 | 0 | |
| Independent | 0 | 1,186 (0.7%) | 0 | 0 | 0 | 0 | |
| Socialist Alternative | 0 | 1,027 (0.6%) | 0 | 0 | 0 | 0 | |
| Respect | 0 | 713 (0.4%) | 0 | 0 | 0 | 0 | |
| Ind. Conservative | 0 | 582 (0.4%) | 0 | 0 | 0 | 0 | |
| Communist | 0 | 546 (0.3%) | 0 | 0 | 0 | 0 | |
| CPA | 0 | 393 (0.2%) | 0 | 0 | 0 | 0 | |
2003 Welsh Assembly election additional members
In the election for additional members in the 2003 National Assembly for Wales election, the results were as follows: [3]
| Party | Constituency Seats | List Votes (vote %) | D'Hondt Entitlement | Additional Members Elected | Total Members Elected | Deviation from D'Hondt Entitlement | |
|---|---|---|---|---|---|---|---|
| Labour | 7 | 58,066 (41.61%) | 6 | 0 | 7 | +1 | |
| Plaid Cymru | 0 | 24,799 (17.77%) | 2 | 2 | 2 | 0 | |
| Conservative | 0 | 20,981 (15.03%) | 2 | 1 | 1 | -1 | |
| Liberal Democrats | 0 | 17,746 (12.72%) | 1 | 1 | 1 | 0 | |
| Green | 0 | 6,696 (4.80%) | 0 | 0 | 0 | 0 | |
| UKIP | 0 | 6,113 (4.38%) | 0 | 0 | 0 | 0 | |
| Socialist Labour | 0 | 3,446 (2.47%) | 0 | 0 | 0 | 0 | |
| Cymru Annibynnol | 0 | 1,346 (0.96%) | 0 | 0 | 0 | 0 | |
| ProLife Alliance | 0 | 355 (0.25%) | 0 | 0 | 0 | 0 | |
1999 Welsh Assembly election additional members
In the election for additional members in the 1999 National Assembly for Wales election, the results were as follows:[3]
| Party | Constituency Seats | List Votes (vote %) | D'Hondt Entitlement | Additional Members Elected | Total Members Elected | Deviation from D'Hondt Entitlement | |
|---|---|---|---|---|---|---|---|
| Labour | 7 | 70,625 (41.79%) | 5 | 0 | 7 | +2 | |
| Plaid Cymru | 0 | 50,757 (30.04%) | 4 | 2 | 2 | −2 | |
| Conservative | 0 | 20,993 (12.42%) | 1 | 1 | 1 | 0 | |
| Liberal Democrats | 0 | 18,527 (10.96%) | 1 | 1 | 1 | 0 | |
| Green | 0 | 4,082 (2.42%) | 0 | 0 | 0 | 0 | |
| People's Representative | 0 | 2,074 (1.23%) | 0 | 0 | 0 | 0 | |
| Socialist Alliance | 0 | 1,257 (0.74%) | 0 | 0 | 0 | 0 | |
| Natural Law | 0 | 676 (0.40%) | 0 | 0 | 0 | 0 | |
Notes
- BC denotes borough constituency, CC denotes county constituency.
- The majority is the number of votes the winning candidate receives more than their nearest rival.
- Following his election to the House of Commons, Byron Davies resigned as an AM in May 2015 and was replaced by Altaf Hussain.
References
- https://business.senedd.wales/mgElectionAreaResults.aspx?ID=299
- "Welsh assembly election 2007". BBC News. 2007-03-21. Retrieved 2020-05-31.
- "Welsh National Assembly regional constituency: South Wales West". www.politicsresources.net. Archived from the original on 2017-08-07.