Tree diagram (probability theory)
In probability theory, a tree diagram may be used to represent a probability space.
| Part of a series on statistics |
| Probability theory |
|---|
 |
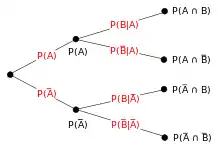


Tree diagrams may represent a series of independent events (such as a set of coin flips) or conditional probabilities (such as drawing cards from a deck, without replacing the cards).[1] Each node on the diagram represents an event and is associated with the probability of that event. The root node represents the certain event and therefore has probability 1. Each set of sibling nodes represents an exclusive and exhaustive partition of the parent event.
The probability associated with a node is the chance of that event occurring after the parent event occurs. The probability that the series of events leading to a particular node will occur is equal to the product of that node and its parents' probabilities.
See also
Notes
- "Tree Diagrams". BBC GCSE Bitesize. BBC. p. 1,3. Retrieved 25 October 2013.
References
- Charles Henry Brase, Corrinne Pellillo Brase: Understanding Basic Statistics. Cengage Learning, 2012, ISBN 9781133713890, pp. 205–208 (online copy at Google)
External links
- tree diagrams - examples and applications
| Wikimedia Commons has media related to Probability trees. |
