Web mapping
Web mapping or online mapping is the process of using the maps delivered by geographic information systems (GIS) on the Internet, more specifically in the World Wide Web (WWW). A web map or online map is both served and consumed, thus web mapping is more than just web cartography, it is a service by which consumers may choose what the map will show.[1] Web GIS emphasizes geodata processing aspects more involved with design aspects such as data acquisition and server software architecture such as data storage and algorithms, than it does the end-user reports themselves.[2]
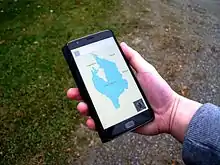
The terms web GIS and web mapping remain somewhat synonymous. Web GIS uses web maps, and end users who are web mapping are gaining analytical capabilities. The term location-based services refers to web mapping consumer goods and services.[3] Web mapping usually involves a web browser or other user agent capable of client-server interactions.[4] Questions of quality, usability, social benefits, and legal constraints are driving its evolution.[5][6]
The advent of web mapping can be regarded as a major new trend in cartography. Until recently cartography was restricted to a few companies, institutes and mapping agencies, requiring relatively expensive and complex hardware and software as well as skilled cartographers and geomatics engineers.
Web mapping has brought many geographical datasets, including free ones generated by OpenStreetMap and proprietary datasets owned by HERE, Google, Tencent, TomTom, and others. A range of free software to generate maps has also been conceived and implemented alongside proprietary tools like ArcGIS. As a result, the barrier to entry for serving maps on the web has been lowered.
Types
A first classification of web maps has been made by Kraak in 2001.[2] He distinguished static and dynamic web maps and further distinguished interactive and view only web maps. Today there an increased number of dynamic web maps types, and static web map sources.
Analytical web maps
Analytical web maps offer GIS analysis. The geodata can be a static provision, or needs updates. The borderline between analytical web maps and web GIS is fuzzy. Parts of the analysis can be carried out by the GIS geodata server. As web clients gain capabilities processing is distributed.
Animated and realtime
Realtime maps show the situation of a phenomenon in close to realtime (only a few seconds or minutes delay).[7] They are usually animated. Data is collected by sensors and the maps are generated or updated at regular intervals or on demand.
Animated maps show changes in the map over time by animating one of the graphical or temporal variables.[8] Technologies enabling client-side display of animated web maps include scalable vector graphics (SVG), Adobe Flash, Java, QuickTime, and others. Web maps with real-time animation include weather maps, traffic congestion maps and vehicle monitoring systems.
CartoDB launched an open source library, Torque,[9] which enables the creation of dynamic animated maps with millions of records. Twitter uses this technology to create maps to reflect how users reacted to news and events worldwide.
Collaborative web maps
Collaborative maps are a developing potential.[10] In proprietary or open source collaborative software, users collaborate to create and improve the web mapping experience. Some collaborative web mapping projects are:
- Google Map Maker
- Here Map Creator
- OpenStreetMap
- WikiMapia
- meta:Maps - a survey of Wikimedia movement web mapping proposals
Online atlases
The traditional atlas goes through a remarkably large transition when hosted on the web. Atlases can cease their printed editions or offer printing on demand. Some atlases also offer raw data downloads of the underlying geospatial data sources.
Static web maps
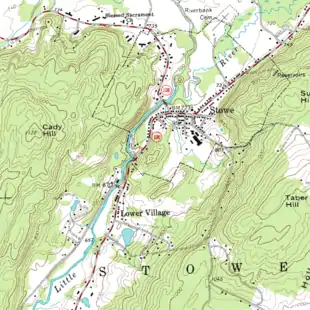
Static web pages are view only without animation or interactivity. These files are created once, often manually, and infrequently updated. Typical graphics formats for static web maps are PNG, JPEG, GIF, or TIFF (e.g., drg) for raster files, SVG, PDF or SWF for vector files. These include scanned paper maps not designed as screen maps. Paper maps have a much higher resolution and information density than typical computer displays of the same physical size, and might be unreadable when displayed on screens at the wrong resolution.[2]
Web GIS in the cloud
Various companies now offer web mapping as a cloud based software as a service. These service providers allow users to create and share maps by uploading data to their servers (cloud storage). The maps are created either by using an in browser editor or writing scripts that leverage the service providers API's.
Evolving paper cartography
Compared to traditional techniques, mapping software has many advantages. The disadvantages are also stated.
- Web maps can easily deliver up to date information. If maps are generated automatically from databases, they can display information in almost realtime. They don't need to be printed, mastered and distributed. Examples:
- A map displaying election results, as soon as the election results become available.
- A traffic congestion map using traffic data collected by sensor networks.
- A map showing the current locations of mass transit vehicles such as buses or trains, allowing patrons to minimize their waiting time at stops or stations, or be aware of delays in service.
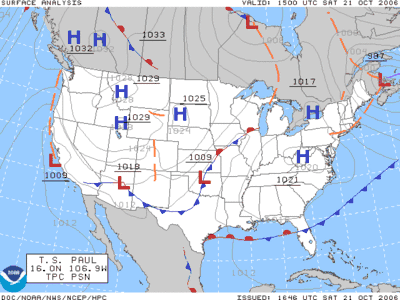
- Weather maps, such as NEXRAD.
- Software and hardware infrastructure for web maps is cheap. Web server hardware is cheaply available and many open source tools exist for producing web maps. Geodata, on the other hand, is not; satellites and fleets of automobiles use expensive equipment to collect the information on an ongoing basis. Perhaps owing to this, many people are still reluctant to publish geodata, especially in places where geodata are expensive. They fear copyright infringements by other people using their data without proper requests for permission.
- Product updates can easily be distributed. Because web maps distribute both logic and data with each request or loading, product updates can happen every time the web user reloads the application. In traditional cartography, when dealing with printed maps or interactive maps distributed on offline media (CD, DVD, etc.), a map update takes serious efforts, triggering a reprint or remastering as well as a redistribution of the media. With web maps, data and product updates are easier, cheaper, and faster, and occur more often. Perhaps owing to this, many web maps are of poor quality, both in symbolization, content and data accuracy.
- Web maps can combine distributed data sources. Using open standards and documented APIs one can integrate (mash up) different data sources, if the projection system, map scale and data quality match. The use of centralized data sources removes the burden for individual organizations to maintain copies of the same data sets. The downside is that one has to rely on and trust the external data sources. In addition, with detailed information available and the combination of distributed data sources, it is possible to find out and combine a lot of private and personal information of individual persons. Properties and estates of individuals are now accessible through high resolution aerial and satellite images throughout the world to anyone.
- Web maps allow for personalization. By using user profiles, personal filters and personal styling and symbolization, users can configure and design their own maps, if the web mapping systems supports personalization. Accessibility issues can be treated in the same way. If users can store their favourite colors and patterns they can avoid color combinations they can't easily distinguish (e.g. due to color blindness). Despite this, as with paper, web maps have the problem of limited screen space, but more so. This is in particular a problem for mobile web maps; the equipment carried usually has a very small screen, making it less likely that there is room for personalisation.
- Web maps enable collaborative mapping similar to web mapping technologies such as DHTML/Ajax, SVG, Java, Adobe Flash, etc. enable distributed data acquisition and collaborative efforts. Examples for such projects are the OpenStreetMap project or the Google Earth community. As with other open projects, quality assurance is very important, however, and the reliability of the internet and web server infrastructure is not yet good enough. Especially if a web map relies on external, distributed data sources, the original author often cannot guarantee the availability of the information.
- Web maps support hyperlinking to other information on the web. Just like any other web page or a wiki, web maps can act like an index to other information on the web. Any sensitive area in a map, a label text, etc. can provide hyperlinks to additional information. As an example a map showing public transport options can directly link to the corresponding section in the online train time table. However, development of web maps is complicated enough as it is: Despite the increasing availability of free and commercial tools to create web mapping and web GIS applications, it is still a more complex task to create interactive web maps than to typeset and print images. Many technologies, modules, services and data sources have to be mastered and integrated The development and debugging environments of a conglomerate of different web technologies is still awkward and uncomfortable.
History
|
This section contains some of the milestones of web mapping, online mapping services and atlases.[4]
- 1989: Birth of the WWW, WWW invented at CERN for the exchange of research documents.[11]
- 1993: Xerox PARC Map Viewer, The first mapserver based on CGI/Perl, allowed reprojection styling and definition of map extent.
- 1994: The World Wide Earthquake Locator, the first interactive web mapping mashup was released, based on the Xerox PARC map view.
- 1994: The National Atlas of Canada, The first version of the National Atlas of Canada was released. Can be regarded as the first online atlas.
- 1995: The Gazetteer for Scotland, The prototype version of the Gazetteer for Scotland was released. The first geographical database with interactive mapping.
- 1995: Tiger Mapping Service, from the U.S. Census Bureau, the first national street-level web map, and the first major web map from the U.S. government.
- 1995: MapGuide, First introduced as Argus MapGuide.
- 1996: Center for Advanced Spatial Technologies Interactive Mapper, Based on CGI/C shell/GRASS would allow the user to select a geographic extent, a raster base layer, and number of vector layers to create personalized map.
- 1996: Mapquest, The first popular online Address Matching and Routing Service with mapping output.
- 1996: MultiMap, The UK-based MultiMap website launched offering online mapping, routing and location based services. Grew into one of the most popular UK web sites.
- 1996: Geomedia WebMap 1.0, First version of Geomedia WebMap, already supports vector graphics through the use of ActiveCGM.[12]
- 1996: MapGuide, Autodesk acquired Argus Technologies.and introduced Autodesk MapGuide 2.0.

- 1997: US Online National Atlas Initiative, The USGS received the mandate to coordinate and create the online National Atlas of the United States of America .
- 1997: UMN MapServer 1.0, Developed at the University of Minnesota (UMN) as Part of the NASA ForNet Project. Grew out of the need to deliver remote sensing data across the web for foresters.
- 1997: GeoInfoMapper - GeoInfo Solutions developed the first Java GIS Applet called 'JavaMap'. The application supported the export and conversion of MapInfo data for display in the thematic mapping tool for the web. GeoinfoMapper was demonstrated at the Victoria Computer Show in 1997 and referenced in the Universal Locator project at UC Berkeley School of Information.[13]
- 1998: Terraserver USA, A Web Map Service serving aerial images (mainly b+w) and USGS DRGs was released. One of the first popular WMS. This service is a joint effort of USGS, Microsoft and HP.
- 1998: UMN MapServer 2.0, Added reprojection support (PROJ.4).
- 1998: MapObjects Internet Map Server, ESRI's entry into the web mapping business.
- 1999: National Atlas of Canada, 6th edition, This new version was launched at the ICA 1999 conference in Ottawa. Introduced many new features and topics. Is being improved gradually, since then, and kept up-to-date with technical advancements.
- 2000: ArcIMS 3.0, The first public release of ESRI's ArcIMS.
- 2000: ESRI Geography Network, ESRI founded Geography Network to distribute data and web map services.
- 2000: UMN MapServer 3.0, Developed as part of the NASA TerraSIP Project. This is also the first public, open source release of UMN Mapserver. Added raster support and support for TrueType fonts (FreeType).
- 2001: GeoServer, starts of the GeoServer project (Geoserver History)
- 2001: MapScript 1.0 for UMN MapServer, Adds a lot of flexibility to UMN MapServer solutions.
- 2001: Tirolatlas, A highly interactive online atlas, the first to be based on the SVG standard.
- 2002: UMN MapServer 3.5, Added support for PostGIS and ArcSDE. Version 3.6 adds initial OGC WMS support.
- 2002: ArcIMS 4.0, Version 4 of the ArcIMS web map server.
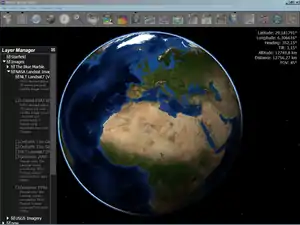
- 2003: NASA World Wind, NASA World Wind Released. An open virtual globe that loads data from distributed resources across the internet. Terrain and buildings can be viewed 3 dimensionally. The (XML based) markup language allows users to integrate their own personal content. This virtual globe needs special software and doesn't run in a web browser.
- 2003: UMN MapServer 4.0, Adds 24bit raster output support and support for PDF and SWF.
- 2004: OpenStreetMap, an open source, open content world map founded by Steve Coast.
- 2004: Yandex Maps is founded.
- 2005: Google Maps, The first version of Google Maps. Based on raster tiles organized in a quad tree scheme, data loading done with XMLHttpRequests. This mapping application became highly popular on the web, also because it allowed other people to integrate google map services into their own website.
- 2005: UMN MapServer introduced as open source by the Open Source Geospatial Foundation (OSGeo). UMN MapServer 4.6, Adds support for SVG.
- 2005: MapGuide Open Source introduced as open source by Autodesk
- 2005: Google Earth, The first version of Google Earth was released building on the virtual globe metaphor. Terrain and buildings can be viewed 3 dimensionally. The KML (XML based) markup language allows users to integrate their own personal content. This virtual globe needs special software and doesn't run in a web browser.
- 2005: OpenLayers, the first version of the open source Javascript library OpenLayers.
- 2006: WikiMapia Launched
- 2009: Nokia made Ovi Maps free on its smartphones.
- 2010: MapBox was founded
- 2012: Apple removed Google Maps as the default mapping app and replaces it with its own mapping app.[14]
- 2013: MapBox announced Vector Tiles for MapBox Streets
Technologies
Web mapping technologies require both server-side and client-side applications. The following is a list of technologies utilized in web mapping.
- Spatial databases are usually object relational databases enhanced with geographic data types, methods and properties. They are necessary whenever a web mapping application has to deal with dynamic data (that changes frequently) or with huge amount of geographic data. Spatial databases allow spatial queries, sub selects, reprojections, and geometry manipulations and offer various import and export formats. PostGIS is a prominent example; it is open source. MySQL also implements some spatial features. Oracle Spatial, Microsoft SQL Server (with the spatial extensions), and IBM DB2 are the commercial alternatives. The Open Geospacial Consortium's (OGC) specification "Simple Features" is a standard geometry data model and operator set for spatial databases. Part 2 of the specification defines an implementation using SQL.
- Tiled web maps display rendered maps made up of raster image "tiles".
- Vector tiles are also becoming more popular—Google and Apple have both transitioned to vector tiles. Mapbox.com also offers vector tiles. This new style of web mapping is resolution independent, and also has the advantage of dynamically showing and hiding features depending on the interaction.
- WMS servers generate maps using parameters for user options such as the order of the layers, the styling and symbolization, the extent of the data, the data format, the projection, etc. The OGC standardized these options. Another WMS server standard is the Tile Map Service. Standard image formats include PNG, JPEG, GIF and SVG.
Courses
Web mapping courses are offered in several universities. Here are some representative ones.
- Open Web Mapping (GEOG 585), offered by Pennsylvania State University, "https://www.e-education.psu.edu/geog585/"
- Web Mapping (GEOG 371), offered by Oregon State University, "https://github.com/jakobzhao/geog371"
- Programming for Web Mapping (MAP 672), offered by University of Kentucky, "http://newmapsplus.uky.edu/new-maps-plus-programs-and-online-courses#map672"
- Web Mapping (GEOG 490), offered by University of Oregon
See also
Notes and references
- Parker, C.J., May, A. and Mitchell, V. (2013), “The role of VGI and PGI in supporting outdoor activities”, Applied Ergonomics, Vol. 44 No. 6, pp. 886–94.
- Kraak, Menno Jan (2001): Settings and needs for web cartography, in: Kraak and Allan Brown (eds), Web Cartography, Francis and Taylor, New York, p. 3–4. see also webpage . Accessed 2007-01-04.
- Parker, C.J., May, A., Mitchell, V. and Burrows, A. (2013), “Capturing Volunteered Information for Inclusive Service Design: Potential Benefits and Challenges”, The Design Journal, Vol. 16 No. 2, pp. 197–218.
- For technological context, see History of the World Wide Web and related topics under History of computer hardware.
- Brown, M.; Sharples, Sarah; Harding, Jenny; Parker, Christopher J.; Bearman, N.; Maguire, M.; Forrest, D.; Haklay, M.; Jackson, M. (2013). "Usability of Geographic Information: Current challenges and future directions" (PDF). Applied Ergonomics. 44 (6): 855–865. doi:10.1016/j.apergo.2012.10.013. PMID 23177775.
- Parker, Christopher J. (2014). "User-centred design of neogeography: the impact of volunteered geographic information on users' perceptions of online map 'mashups'". Ergonomics. 57 (7): 987–997. doi:10.1080/00140139.2014.909950. PMID 24827070. S2CID 13458260.
- Powers, Shelley. (2008). Painting the Web. O'Reilly. ISBN 9780596515096. OCLC 191753336.
- Muehlenhaus, Ian, 1976- (2013-12-10). Web cartography : map design for interactive and mobile devices. ISBN 9781439876220. OCLC 706022809.CS1 maint: multiple names: authors list (link)
- "GitHub - CartoDB/torque: Temporal mapping for CartoDB". 2019-02-13.
- Parker, C.J., May, A.J. and Mitchell, V. (2012), “Understanding Design with VGI using an Information Relevance Framework”, Transactions in GIS, Transactions in GIS: GISRUK Special Issue, Vol. 16 No. 4, pp. 545–560.
- More details are in: History of the World Wide Web#1980–1991: Invention and implementation.
- ActiveCGM is evidently an ActiveX control that displays CGM files.
- See Universal Locator project at UC Berkeley, 1998: .
- Arthur, Charles (2013-11-26). "How Apple Maps won on UK iPhones over Google Maps - despite Waze". the Guardian. Retrieved 2019-07-30.
Further reading
- Fu, P., and J. Sun. 2010. Web GIS: Principles and Applications. ESRI Press. Redlands, CA. ISBN 1-58948-245-X.
- Graham, M. 2010. Neogeography and the Palimpsests of Place. Tijdschrift voor Economische en Sociale Geografie. 101(4), 422-436.
- Kraak, Menno-Jan and Allan Brown (2001): Web Cartography – Developments and prospects, Taylor & Francis, New York, ISBN 0-7484-0869-X.
- Mitchell, Tyler (2005): Web Mapping Illustrated, O'Reilly, Sebastopol, 350 pages, ISBN 0-596-00865-1. This book discusses various Open Source Web Mapping projects and provides hints and tricks as well as examples.
- Peterson, Michael P. (ed.) (2014): Mapping in the Cloud, Guilford, ISBN 978-1-462-51041-2.
- Peterson, Michael P. (ed.) (2003): Maps and the Internet, Elsevier, ISBN 0-08-044201-3.
- Rambaldi G, Chambers R., McCall M, And Fox J. 2006. Practical ethics for PGIS practitioners, facilitators, technology intermediaries and researchers. PLA 54:106-113, IIED, London, UK
- Gaffuri J, 2012. Toward web mapping with vector data. Vol. 7478 of Lecture Notes in Computer Science. Springer, Ch. 7, pp. 87–101. DOI:10.1007/978-3-642-33024-7_7
- Feldman, S 2010. History of Web Mapping - slide deck and History of Web Mapping - mind map
External links
Sites
- UMN MapServer documentation and tutorials
- Webmapping with SVG, Postgis and UMN MapServer tutorials
- International Cartographic Association (ICA), the world body for mapping and GIScience professionals
- Comparison of Online Mapping Tools, Duke University
