Wycombe District Council elections
Wycombe District Council in Buckinghamshire, England was elected every four years from 1973 until 2020.[1] Since the last boundary changes in 2003, 60 councillors were elected from 28 wards.
Political control
Since the first election to the council in 1973 until its merger into Buckinghamshire Council in 2020, political control of the council has been held by the following parties:[2]
| Party in control | Years | |
|---|---|---|
| Conservative | 1973–1995 | |
| No overall control | 1995–1999 | |
| Conservative | 1999–2020 | |
Council elections
- 1973 Wycombe District Council election
- 1976 Wycombe District Council election
- 1979 Wycombe District Council election
- 1983 Wycombe District Council election (New ward boundaries)[3]
- 1987 Wycombe District Council election (District boundary changes took place but the number of seats remained the same)[4]
- 1991 Wycombe District Council election (District boundary changes took place but the number of seats remained the same)[5][6]
- 1995 Wycombe District Council election
- 1999 Wycombe District Council election
- 2003 Wycombe District Council election (New ward boundaries)[7]
- 2007 Wycombe District Council election
- 2011 Wycombe District Council election
- 2015 Wycombe District Council election
- 2019 Wycombe District Council election
By-election results
1995-1999
| Party | Candidate | Votes | % | ±% | |
|---|---|---|---|---|---|
| Labour | Margaret Draper? | 375 | 48.6 | -12.5 | |
| Conservative | 319 | 43.3 | +29.8 | ||
| Liberal Democrats | 77 | 10.0 | -15.4 | ||
| Majority | 56 | 5.3 | |||
| Turnout | 771 | ||||
| Labour hold | Swing | ||||
| Party | Candidate | Votes | % | ±% | |
|---|---|---|---|---|---|
| Liberal Democrats | 408 | 46.2 | +9.7 | ||
| Conservative | 390 | 44.1 | +11.7 | ||
| Labour | 86 | 9.7 | -21.4 | ||
| Majority | 18 | 2.1 | |||
| Turnout | 884 | ||||
| Liberal Democrats hold | Swing | ||||
1999-2003
| Party | Candidate | Votes | % | ±% | |
|---|---|---|---|---|---|
| Conservative | 434 | 55.9 | -0.7 | ||
| Independent | 342 | 44.1 | +0.7 | ||
| Majority | 92 | 11.8 | |||
| Turnout | 776 | ||||
| Conservative hold | Swing | ||||
| Party | Candidate | Votes | % | ±% | |
|---|---|---|---|---|---|
| Conservative | 326 | 49.9 | -20.5 | ||
| Independent | 200 | 30.6 | +30.6 | ||
| Labour | 127 | 19.4 | -10.2 | ||
| Majority | 126 | 19.3 | |||
| Turnout | 653 | 34.0 | |||
| Conservative hold | Swing | ||||
| Party | Candidate | Votes | % | ±% | |
|---|---|---|---|---|---|
| Conservative | Bob Bate? | 542 | 78.0 | +11.7 | |
| Labour | 153 | 22.0 | -11.7 | ||
| Majority | 389 | 56.0 | |||
| Turnout | 695 | 29.1 | |||
| Conservative hold | Swing | ||||
2003-2007
| Party | Candidate | Votes | % | ±% | |
|---|---|---|---|---|---|
| Conservative | David Bainton | 2,172 | 54.1 | +5.4 | |
| Liberal Democrats | Ian Forbes | 1,092 | 27.2 | +5.6 | |
| Labour | Ian Bates | 748 | 18.6 | +7.9 | |
| Majority | 1,080 | 26.9 | |||
| Turnout | 4,012 | 62.8 | |||
| Conservative hold | Swing | ||||
| Party | Candidate | Votes | % | ±% | |
|---|---|---|---|---|---|
| Conservative | Simon Bazley | 404 | 74.5 | +39.0 | |
| Independent | Jonathan Ashman | 138 | 25.5 | -18.5 | |
| Majority | 266 | 49.0 | |||
| Turnout | 542 | ||||
| Conservative gain from Independent | Swing | ||||
| Party | Candidate | Votes | % | ±% | |
|---|---|---|---|---|---|
| Conservative | Ian McEnnis | 357 | 47.4 | +8.2 | |
| Liberal Democrats | Neil Timberlake | 316 | 42.0 | +10.9 | |
| Labour | Ian Bates | 80 | 10.6 | +10.6 | |
| Majority | 41 | 5.4 | |||
| Turnout | 753 | 18.8 | |||
| Conservative hold | Swing | ||||
| Party | Candidate | Votes | % | ±% | |
|---|---|---|---|---|---|
| Conservative | Helen Wilkinson-Makey | 491 | 56.4 | +14.8 | |
| Liberal Democrats | Ivor Coleman | 244 | 28.0 | +28.0 | |
| Labour | Janet Pritchard | 135 | 15.5 | +15.5 | |
| Majority | 247 | 28.4 | |||
| Turnout | 870 | 22.4 | |||
| Conservative gain from Independent | Swing | ||||
| Party | Candidate | Votes | % | ±% | |
|---|---|---|---|---|---|
| Conservative | Katrina Wood | 888 | 65.8 | +17.1 | |
| Liberal Democrats | Ian Forbes | 387 | 28.7 | +7.1 | |
| Labour | Sadia Hussain | 75 | 5.6 | -5.1 | |
| Majority | 501 | 37.1 | |||
| Turnout | 1,350 | 21.6 | |||
| Conservative hold | Swing | ||||
| Party | Candidate | Votes | % | ±% | |
|---|---|---|---|---|---|
| Conservative | Larry Haig | 1,040 | 65.4 | +9.7 | |
| Liberal Democrats | William Barnes | 549 | 34.6 | +4.7 | |
| Majority | 491 | 30.8 | |||
| Turnout | 1,589 | 24.3 | |||
| Conservative hold | Swing | ||||
2007-2011
| Party | Candidate | Votes | % | ±% | |
|---|---|---|---|---|---|
| Conservative | Richard Scott | 928 | 61.1 | +3.6 | |
| Liberal Democrats | Carol Cummins | 382 | 25.1 | -8.4 | |
| Labour | Paul Mansell | 209 | 13.8 | +4.9 | |
| Majority | 546 | 36.0 | |||
| Turnout | 1,519 | 22.6 | |||
| Conservative hold | Swing | ||||
| Party | Candidate | Votes | % | ±% | |
|---|---|---|---|---|---|
| Liberal Democrats | Steve Guy | 733 | 54.1 | +36.5 | |
| Conservative | Tim Hewish | 408 | 30.1 | -10.9 | |
| Labour | Ian Bates | 214 | 15.8 | -25.6 | |
| Majority | 325 | 24.0 | |||
| Turnout | 1,355 | 31.0 | |||
| Liberal Democrats gain from Labour | Swing | ||||
References
- "Today is the day 5 councils become one - everything you need to know". Bucks Free Press. 1 April 2020. Retrieved 7 April 2020.
- "Wycombe". BBC News Online. Retrieved 27 March 2010.
- The District of Wycombe (Electoral Arrangements) Order 1980
- legislation.gov.uk - The Buckinghamshire (District Boundaries) Order 1987. Retrieved on 6 November 2015.
- legislation.gov.uk - The Berkshire, Buckinghamshire, Hampshire, Oxfordshire and Surrey (County Boundaries) Order 1991. Retrieved on 5 November 2015.
- legislation.gov.uk - The Buckinghamshire, Hertfordshire, Northamptonshire and Oxfordshire (County Boundaries) Order 1991. Retrieved on 5 November 2015.
- legislation.gov.uk - The District of Wycombe (Electoral Changes) Order 2002. Retrieved on 4 October 2015.
- "Labour regains Burnley". guardian.co.uk. 30 November 2001. Retrieved 27 March 2010.
- "Lib Dem wins Totteridge by-election". Bucks Free Press. 24 April 2009. Retrieved 27 March 2010.
External links
| Buckinghamshire Council | |
|---|---|
| Buckinghamshire County Council | |
| Milton Keynes Council | |
| Aylesbury Vale District Council | |
| Chiltern District Council |
|
| South Bucks District Council |
|
| Wycombe District Council |
|
| |
| Towns (component areas and hamlets) | 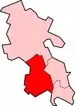 | |
|---|---|---|
| Other civil parishes (component villages and hamlets) |
| |
| Former districts and boroughs | ||
| Former constituencies | ||
This article is issued from Wikipedia. The text is licensed under Creative Commons - Attribution - Sharealike. Additional terms may apply for the media files.