Buckinghamshire County Council elections
Buckinghamshire County Council in England was elected every four years from 1973 until 2020.[1]
Political control
Since 1973 until its merger into Buckinghamshire Council in 2020, political control of the council has been held by the following parties:[2]
| Party in control | Years | |
|---|---|---|
| Conservative | 1973–2020 | |
In the 1993 elections, it was the only county council to have elected a majority of Conservative councillors, while the party lost majorities on strongholds such as Essex, Kent and Lincolnshire.
Council elections
- 1973 Buckinghamshire County Council election
- 1977 Buckinghamshire County Council election
- 1981 Buckinghamshire County Council election
- 1985 Buckinghamshire County Council election
- 1989 Buckinghamshire County Council election
- 1993 Buckinghamshire County Council election
- 1997 Buckinghamshire County Council election
- 2001 Buckinghamshire County Council election
- 2005 Buckinghamshire County Council election (boundary changes increased the number of seats by 2)[3]
- 2009 Buckinghamshire County Council election
- 2013 Buckinghamshire County Council election
- 2017 Buckinghamshire County Council election
County result maps
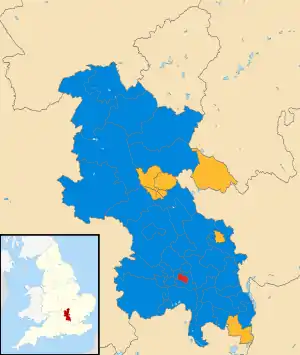 2005 results map
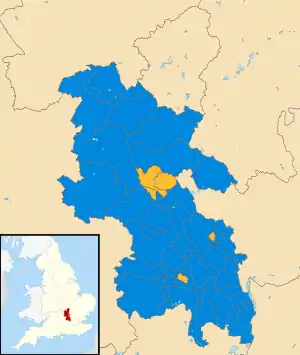 2009 results map
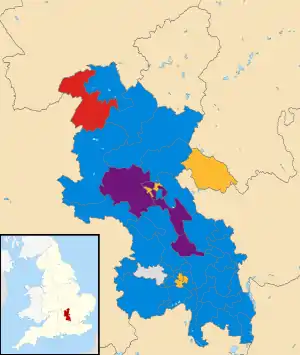 2013 results map
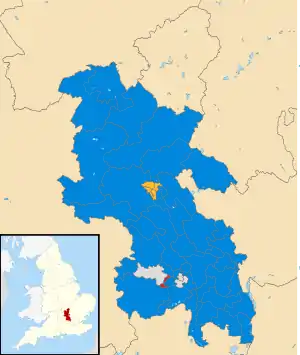 2017 results map
By-election results
1997-2001
| Party | Candidate | Votes | % | ±% | |
|---|---|---|---|---|---|
| Conservative | David Graves | 1,232 | 57.4 | +8.8 | |
| Liberal Democrats | Eileen Young | 505 | 23.5 | +23.5 | |
| Labour | Ian Chapman | 410 | 19.1 | -10.2 | |
| Majority | 727 | 33.9 | |||
| Turnout | 2,147 | 33.4 | |||
| Conservative hold | Swing | ||||
| Party | Candidate | Votes | % | ±% | |
|---|---|---|---|---|---|
| Conservative | Marion Clayton | 1,211 | 55.8 | +4.0 | |
| Liberal Democrats | Robert Hammond | 958 | 44.2 | +10.3 | |
| Majority | 253 | 11.6 | |||
| Turnout | 2,169 | 39.0 | |||
| Conservative hold | Swing | ||||
| Party | Candidate | Votes | % | ±% | |
|---|---|---|---|---|---|
| Labour | Caroline Martnes | 579 | 61.3 | +15.9 | |
| Conservative | Frank Downes | 266 | 28.2 | -1.2 | |
| Liberal Democrats | Matthew Brown | 99 | 10.5 | -14.7 | |
| Majority | 313 | 33.1 | |||
| Turnout | 944 | 17.6 | |||
| Labour hold | Swing | ||||
2001-2005
| Party | Candidate | Votes | % | ±% | |
|---|---|---|---|---|---|
| Conservative | Peter Hardy | 933 | 77.1 | +13.9 | |
| Liberal Democrats | Peter Chapman | 277 | 22.9 | -2.7 | |
| Majority | 656 | 54.2 | |||
| Turnout | 1,210 | 22.2 | |||
| Conservative hold | Swing | ||||
| Party | Candidate | Votes | % | ±% | |
|---|---|---|---|---|---|
| Conservative | Hedley Cadd | 1,098 | 51.1 | +7.6 | |
| Labour | Robin Stuchbury | 559 | 26.0 | -2.6 | |
| Liberal Democrats | Ian Metherell | 491 | 22.8 | -5.1 | |
| Majority | 539 | 25.1 | |||
| Turnout | 2,148 | 19.4 | |||
| Conservative hold | Swing | ||||
2005-2009
| Party | Candidate | Votes | % | ±% | |
|---|---|---|---|---|---|
| Conservative | Peter Cartwright | 1,277 | 61.0 | +13.6 | |
| Liberal Democrats | Trevor Snaith | 596 | 28.5 | -2.1 | |
| Labour | Clare Martens | 221 | 10.5 | -11.5 | |
| Majority | 681 | 32.5 | |||
| Turnout | 2,094 | 20.5 | |||
| Conservative hold | Swing | ||||
| Party | Candidate | Votes | % | ±% | |
|---|---|---|---|---|---|
| Conservative | Trevor Egleton | 875 | 57.3 | -4.8 | |
| Independent | William Foulds | 283 | 18.5 | +18.5 | |
| Liberal Democrats | Ingrid Greenhow | 280 | 18.3 | -1.8 | |
| Labour | Lindsey Gillan | 89 | 5.8 | -11.9 | |
| Majority | 592 | 38.8 | |||
| Turnout | 1,527 | 23.8 | |||
| Conservative hold | Swing | ||||
2009-2013
| Party | Candidate | Votes | % | ±% | |
|---|---|---|---|---|---|
| Conservative | Steven Adams | 1,840 | 46.6 | -3.7 | |
| Liberal Democrats | Davida Allen | 1,768 | 44.8 | +0.0 | |
| UKIP | Christopher Cooke | 140 | 3.5 | +3.5 | |
| Labour | Lynda Greenhill | 106 | 2.7 | -2.2 | |
| Green | Phil Folly | 95 | 2.4 | +2.4 | |
| Majority | 72 | 1.8 | |||
| Turnout | 3,949 | 30.6 | |||
| Conservative hold | Swing | ||||
References
- "Today is the day 5 councils become one - everything you need to know". Bucks Free Press. 1 April 2020. Retrieved 7 April 2020.
- "Buckinghamshire". BBC News Online. 19 April 2009. Retrieved 10 September 2009.
- "Local election results: Buckinghamshire". BBC News Online. Retrieved 6 September 2009.
- "Declaration of result of poll" (PDF). South Bucks District Council. Archived from the original (PDF) on 27 September 2011. Retrieved 6 September 2009.
- "Tories take seats". Buckingham & Winslow Advertiser. 25 November 2004.
- "Election results for Ryemead, Tylers Green & Loudwater". Buckinghamshire County Council. Archived from the original on 4 June 2011. Retrieved 6 September 2009.
- "Election results for Stoke Poges & Farnham Common". Buckinghamshire County Council. Archived from the original on 4 June 2011. Retrieved 6 September 2009.
- "Election results for Amersham". Buckinghamshire County Council. Archived from the original on 4 June 2011. Retrieved 25 September 2009.
External links
| Buckinghamshire Council | |
|---|---|
| Buckinghamshire County Council | |
| Milton Keynes Council | |
| Aylesbury Vale District Council | |
| Chiltern District Council |
|
| South Bucks District Council |
|
| Wycombe District Council |
|
| |
This article is issued from Wikipedia. The text is licensed under Creative Commons - Attribution - Sharealike. Additional terms may apply for the media files.