1943 Danish Folketing election
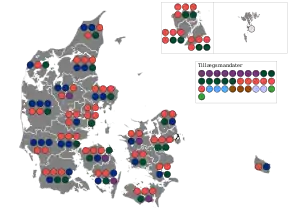
Folketing elections were held in Denmark on 23 March 1943 alongside Landsting elections,[1] except in the Faroe Islands where they were held on 3 May. They were the first elections during the German occupation, and although many people feared how the Germans might react to the election, the event took place peacefully.[2] The voter turnout was at 89.5%, the highest of any Danish parliamentary election, and became a demonstration against the occupation. The Social Democratic Party remained the largest in the Folketing, with 66 of the 149 seats. After the elections, leading German newspapers expressed disappointment and indignation with the lack of political evolution among the Danish voters.[2]
| ||||||||||||||||||||||||||||||||||||||||||||||||||||||||
All 149 seats in the Folketing 75 seats needed for a majority | ||||||||||||||||||||||||||||||||||||||||||||||||||||||||
|---|---|---|---|---|---|---|---|---|---|---|---|---|---|---|---|---|---|---|---|---|---|---|---|---|---|---|---|---|---|---|---|---|---|---|---|---|---|---|---|---|---|---|---|---|---|---|---|---|---|---|---|---|---|---|---|---|
This lists parties that won seats. See the complete results below. | ||||||||||||||||||||||||||||||||||||||||||||||||||||||||
 | ||||||||||||||||||||||||||||||||||||||||||||||||||||||||
 |
|---|
| This article is part of a series on the politics and government of Denmark |
|
|
The Communist Party of Denmark had been banned since 1941 and could not participate in these elections.
95% of the vote went to the four biggest, traditional democratic parties. In the years since, there has been some debate about whether this can be seen as democratic support for the government's "cooperation" policy (samarbejdspolitikken) with the German occupation authorities.[3] Some have argued that the result showed a broad unity of opinion in the population and among politicians in support of the relatively cooperative line taken by the government. Bertel Haarder, citing Knud Kristensen, has argued that the vote was sold as one of solidarity with the Danish constitution, democracy, and a rejection of totalitarian elements in society, and cannot therefore be seen as an explicit endorsement by the population of the government's line.[3]
Results
 | ||||||
|---|---|---|---|---|---|---|
| Party | Votes | % | Seats | +/– | ||
| Denmark proper | ||||||
| Social Democratic Party | 894,632 | 44.5 | 66 | +2 | ||
| Conservative People's Party | 421,523 | 21.0 | 31 | +5 | ||
| Venstre | 376,850 | 18.7 | 28 | –2 | ||
| Danish Social Liberal Party | 175,179 | 8.7 | 13 | –1 | ||
| Danish Unity | 43,367 | 2.2 | 3 | +3 | ||
| National Socialist Workers' Party | 43,309 | 2.1 | 3 | 0 | ||
| Justice Party of Denmark | 31,323 | 1.6 | 2 | –1 | ||
| Farmers' Party | 24,572 | 1.2 | 2 | –2 | ||
| Independents | 28 | 0.0 | 0 | 0 | ||
| Invalid/blank votes | 29,800 | – | – | – | ||
| Total | 2,040,583 | 100 | 148 | 0 | ||
| Registered voters/turnout | 2,280,716 | 89.5 | – | – | ||
| Faroe Islands | ||||||
| Independent[lower-alpha 1] | 3,452 | 48.2 | 1 | +1 | ||
| Venstre-Union Party | 2,308 | 32.3 | 0 | –1 | ||
| Social Democratic Party | 1,385 | 19.4 | 0 | 0 | ||
| Invalid/blank votes | – | – | – | |||
| Total | 7,155 | 100 | 1 | 0 | ||
| Source: Nohlen & Stöver | ||||||
Notes
- The Faroes seat was won by Þ Petersen, an independent who was a member of the People's Party. However, his election victory was not recognised until 16 August 1945,[4] only two and a half months before the elections that year.
References
- Dieter Nohlen & Philip Stöver (2010) Elections in Europe: A data handbook, p524 ISBN 978-3-8329-5609-7
- Nordengaard, J. P. (1949). Valgene til Rigsdagen gennem 100 Aar (in Danish). Roskilde Dagbladstrykkeri. pp. chapter III, pp. 7–8.
- Bertel, Haarder (21 September 2005). "Nye myter om samarbejdspolitikken" (in Danish). Information. Retrieved 14 February 2013.
- Nohlen & Stöver, p540
| Folketing elections |
|
|---|---|
| Landsting elections | |
| European elections | |
| Local elections | |
| Other elections |
|
| Referendums | |
| |