1965 Atlantic hurricane season
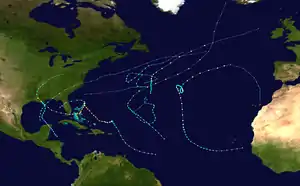
The 1965 Atlantic hurricane season was the first to use the modern-day bounds for an Atlantic hurricane season, which are June 1 to November 30. These dates conventionally delimit the period of each year when most tropical cyclones form in the Atlantic basin. It was a slightly below average season, with 10 tropical cyclones developing and reaching tropical storm intensity. Four of the storms strengthened into hurricanes. One system reached major hurricane intensity – Category 3 or higher on the Saffir–Simpson hurricane scale. The first system, an unnamed tropical storm, developed during the month of June in the southern Gulf of Mexico. The storm moved northward across Central America, but caused no known impact in the region. It struck the Florida Panhandle and caused minor impact across much of the Southern United States. Tropical cyclogenesis halted for over two months, until Anna formed on August 21. The storm remained well away from land in the far North Atlantic Ocean and caused no impact.
| 1965 Atlantic hurricane season | |
|---|---|
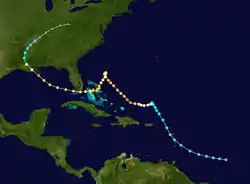
 Season summary map | |
| Seasonal boundaries | |
| First system formed | June 13, 1965 |
| Last system dissipated | December 2, 1965 |
| Strongest storm | |
| Name | Betsy |
| • Maximum winds | 140 mph (220 km/h) (1-minute sustained) |
| • Lowest pressure | 942 mbar (hPa; 27.82 inHg) |
| Seasonal statistics | |
| Total depressions | 13 |
| Total storms | 10 |
| Hurricanes | 4 |
| Major hurricanes (Cat. 3+) | 1 |
| Total fatalities | 76 |
| Total damage | $1.68 billion (1965 USD) |
| Related articles | |
Hurricane Betsy was the strongest and most devastating storm of the season. Extensive damage from Betsy was reported in the Bahamas, Florida, and Louisiana, particularly the New Orleans area. It was the first hurricane in the history of the United States to result in at least $1 billion (1965 USD) in losses. Hurricane Carol meandered in the eastern Atlantic for over two weeks from mid-September to very early October. Impact on land from Carol was minimal. In late September, Tropical Storm Debbie developed in the northwestern Caribbean Sea and moved slowly across the region, before later reaching the Gulf of Mexico. The storm dissipated just offshore of Louisiana, which resulted in only minor impact along the Gulf Coast of the United States. The final tropical cyclone, Hurricane Elena, formed on October 12. Elena remained at sea for nearly a week and caused no damage on land. Collectively, the storms of the 1965 Atlantic hurricane season caused 76 fatalities and $1.45 billion in damage, almost entirely due to Hurricane Betsy.
Season summary
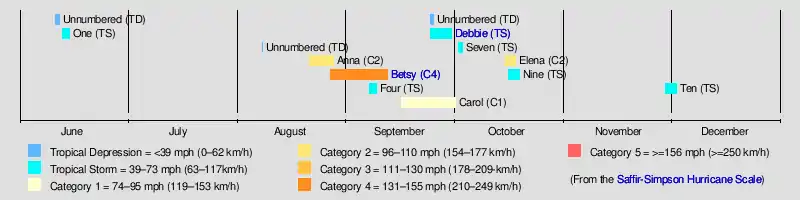
The Atlantic hurricane season officially began on June 1, 1965. This was the first Atlantic hurricane season to start on June 1 and end on November 30,[1][2] which is the modern-day season bounds.[3] It was a below average season in which six tropical depressions formed. All six of the depressions attained tropical storm status, and four of these attained hurricane status.[4] Furthermore, one storm reached major hurricane status – Category 3 or greater on the Saffir–Simpson Hurricane Scale.[5] Two tropical storms and one hurricane made landfall during the season and caused 76 fatalities and about $1.45 billion in damage.[4]
Season activity began with the development of an unnamed tropical storm on June 13. However, the season briefly became dormant after the storm dissipated on June 15, and there were no other tropical cyclones in June or July. The next system, Hurricane Anna, formed on August 21, more than two months later. Later in August, Hurricane Betsy developed and eventually became the most intense tropical cyclone of the 1965 season. In mid-September, Hurricane Carol formed in the eastern Atlantic and meandered for over two weeks. The next system, Tropical Storm Debbie, developed in the northwestern Caribbean Sea on September 24. Hurricane Elena, the final tropical cyclone,[4] developed on October 12 and dissipated on October 18,[5] slightly less than two weeks before the official end of the season on November 30.[1]
The season's activity was reflected with an accumulated cyclone energy (ACE) rating of 84,[6] which was below the 1950-2000 average of 96.1. ACE is, broadly speaking, a measure of the power of the hurricane multiplied by the length of time it existed, so storms that last a long time, as well as particularly strong hurricanes, have high ACEs. It is only calculated for full advisories on tropical cyclones with winds exceeding 39 mph (63 km/h), which is tropical storm strength.[7]
Systems
Tropical Storm One
| Tropical storm (SSHWS) | |
 | |
| Duration | June 13 – June 15 |
|---|---|
| Peak intensity | 50 mph (85 km/h) (1-min) 1005 mbar (hPa) |
A cut-off low pressure area developed from a shear trough in the northwestern Gulf of Mexico on June 9. The low caused the detachment of a disturbance from the Intertropical convergence zone, which was located near the south coast of Guatemala. After moving across Guatemala and Mexico, the low emerged into the Gulf of Mexico on June 13. The low intensified on the following day, reaching tropical storm status at 0000 UTC.[4] It likely was a subtropical storm, however, the lack of consistent satellite data precludes such a classification. Operationally, the system was considered a tropical depression for its entire duration, thus, this went unnamed.[8] The storm began curving northeastward, and by early on June 15, it peaked with winds of 50 mph (85 km/h).[4]
Later that day at 1200 UTC, the storm made landfall near Santa Rosa Beach, Florida at the same intensity. Inland, the storm continued northeastward and became extratropical over eastern Georgia at 0000 UTC on June 16. Tides along the coast of the Florida Panhandle were 3–4 feet (0.91–1.22 m) above normal. The storm brought sustained winds of 50 to 60 mph (85 to 105 km/h) with gusts up to 75 mph (120 km/h) at Alligator Point. Winds blew the roof off of two beach cottages on St. George Island, while tides sank or washed ashore several small boats.[4] The storm also produced rainfall up to 8.75 inches (222 mm) in Wewahitchka,[9] but no flooding occurred. Two tornadoes were spawned in Florida, with one damaging houses and a mobile home in Live Oak. The storm also brought rainfall to several other states.[4]
Hurricane Anna
| Category 2 hurricane (SSHWS) | |
  | |
| Duration | August 21 – August 25 |
|---|---|
| Peak intensity | 105 mph (165 km/h) (1-min) 976 mbar (hPa) |
A weak circulation was noted by Television Infrared Observation Satellite (TIROS) near Cape Verde on August 16. During the next five days, the system tracked west-northwestward or northwestward, while conditions gradually became favorable for tropical cyclogenesis. At 0600 UTC on August 21, it is estimated that the system became Tropical Storm Anna. While Anna was tracking north-northeastward on August 23, an eye feature appeared on TIROS. After another aircraft reported an eye on its radar, Anna was upgraded to a hurricane later that day. Late on August 24, Anna reached maximum sustained winds of 100 mph (160 km/h) while accelerating northeastward. Anna began losing tropical characteristics, and early on the following day, it transitioned into an extratropical storm while about halfway between the Azores and Greenland.[4]
Hurricane Betsy
| Category 4 hurricane (SSHWS) | |
  | |
| Duration | August 27 – September 12 |
|---|---|
| Peak intensity | 140 mph (220 km/h) (1-min) 942 mbar (hPa) |
A tropical disturbance developed into a tropical depression on August 27, while well east of the Windward Islands. It tracked generally west-northward until crossing the Leeward Islands on August 28. No impact was reported in the islands.[4] After re-curving to the northwest, the depression strengthened into Tropical Storm Betsy on August 29.[5] Betsy then rapidly intensified and became a Category 1 hurricane later that day.[5][4] It executed a small cyclonic loop, before turning west on September 1. Significant intensification resumed later that day. By late on September 3, Betsy became a Category 4 hurricane. While northeast of the Bahamas, Betsy moved erratically and executed another cyclonic loop. The storm steadily weakened, and was briefly downgraded to a Category 2 hurricane early on September 6. However, it promptly re-strengthened into a Category 3 hurricane. Betsy then tracked southwestward and then westward through the Bahamas.[5] The storm produced very strong winds and rough seas in the Bahamas. Damage reached $14 million and 1 death occurred in the island chain.[4]
By early on September 8, Betsy made landfall on Key Largo as a Category 3 hurricane.[5] In South Florida, the storm brought strong winds and significant storm surge. In the Upper Florida Keys, water reached several feet in height, which inundated highways and the first floor of buildings. Nearly all of the land south of Homestead Air Force Base and east of U.S. Route 1 was covered by water. There were 8 deaths and $120 million in losses, which included both property and agriculture.[10] Betsy entered into the Gulf of Mexico and re-strengthened into a Category 4 hurricane on September 9. While approaching the Gulf Coast of the United States, Betsy peaked with winds of 155 mph (250 km/h), slightly below the threshold for Category 5 hurricane status. However, further intensification was halted after Betsy made landfall in Grand Isle, Louisiana later on September 9.[5] In Louisiana, strong winds and rough seas caused extensive damage. Storm surge inundated the levees in New Orleans, flooding much of the city. Throughout the state, more than 22,000 homes were either damaged or destroyed, and 168,000 people were left without electricity. The storm caused more than 17,000 injuries and resulted in 58 deaths.[10] Damage in the state of Louisiana reached $1.2 billion. Once inland, the storm rapidly weakened, and became extratropical over Ohio on September 12.[5] Impact in other states ranged from minor to moderate. Overall, Betsy caused about $1.43 billion in damage and 76 fatalities. Betsy was the first hurricane in the United States to cause at least $1 billion in losses.[4][11]
Tropical Storm Four
| Tropical storm (SSHWS) | |
  | |
| Duration | September 7 – September 9 |
|---|---|
| Peak intensity | 60 mph (95 km/h) (1-min) 991 mbar (hPa) |
A cold front moved eastward from North America into the western Atlantic Ocean on August 28. An extratropical low developed on August 31 over the north Atlantic, which degenerated into a trough three days later. On September 4, another extratropical storm developed, located about 800 mi (1,285 km) south of Newfoundland. The system attained gale-force winds a day later, and turned westward on September 6, steered by a building ridge to the north. On September 7, the storm transitioned into a tropical storm, after its wind field became more symmetrical. Later that day, the storm attain winds of 60 mph (95 km/h), recorded by nearby ships. The storm turned to the east and northeast, crossing over its former path. On September 10, the tropical storm again transitioned into an extratropical storm, which later passed southeast of Newfoundland. The storm moved across the northern Atlantic Ocean, dissipating on September 13 southwest of Ireland.[12]
Hurricane Carol
| Category 1 hurricane (SSHWS) | |
.JPG.webp)  | |
| Duration | September 16 – September 30 |
|---|---|
| Peak intensity | 90 mph (150 km/h) (1-min) 974 mbar (hPa) |
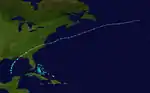
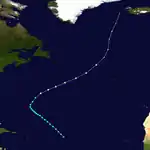
A tropical wave emerged into the Atlantic from the west coast of Africa on September 15[13] and developed into a tropical depression by early on the following day. It headed steadily westward and strengthened into Tropical Storm Carol late on September 17. The storm began curving northwestward by the following day.[5] Operationally, advisories were not initiated until 1900 UTC on September 19, after winds had already reached 50 mph (85 km/h).[14] Carol then slowed and began turning north-northward. Later on September 20, a Navy reconnaissance flight confirmed a circulation and also measured hurricane-force winds. Thus, Carol was upgraded to a hurricane at 1800 UTC on September 20.[13]
On September 21, another flight into the storm recorded a minimum pressure of 974 mbar (28.8 inHg), the lowest in relation to Carol. The hurricane accelerated, before slowing in forward motion on September 22. Between September 24 and September 28, the storm drifted and executed a small cyclonic loop.[13] Thereafter, Carol re-accelerated and was briefly upgraded to a Category 2 hurricane following an Air Force Reconnaissance report of 100 mph (155 km/h) winds. While passing northwest of the Azores, a weather station on Corvo Island reported a sustained wind speed of 64 mph (103 km/h) and a gust up to 80 mph (130 km/h). The storm curved east-southeastward, weakened, and transitioned into an extratropical cyclone while located west of Portugal on October 1.[15]
Tropical Storm Debbie
| Tropical storm (SSHWS) | |
.jpg.webp) 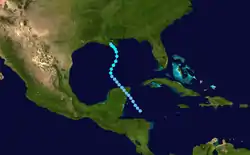 | |
| Duration | September 24 – September 30 |
|---|---|
| Peak intensity | 60 mph (95 km/h) (1-min) 1000 mbar (hPa) |
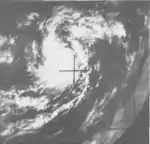
A low pressure area in the northwestern Caribbean Sea developed into a tropical depression on September 24.[5] The depression brought locally heavy rainfall to areas of Honduras while tracking northwestward.[4] Despite winds of only 30 mph (45 km/h), the Miami Weather Bureau prematurely named the depression Debbie at 1600 UTC on September 25.[16] Several hours later, Debbie struck the northeastern Yucatán Peninsula.[5][4] After emerging into the Gulf of Mexico early on September 26, the storm was described as "weaker than before", as the convective activity indicated no organization.[4] However, Debbie began to strengthen, reaching tropical storm status on September 28.[5]
After peaked at winds of 50 mph (85 km/h) late on September 28,[5] cooler and drier air caused the storm to weaken.[4] Late on September 29, Debbie was downgraded to a tropical depression and dissipated just offshore Mississippi about twenty-four hours later.[5] Despite its demise, Debbie brought heavy precipitation, especially in Mobile, Alabama, where a 24-hour rainfall record was broken after 16.85 in (428 mm) fell.[9] Within the city of Mobile, hundreds of cars were flooded, while more than 200 people fled their inundated homes.[17] Many roads and businesses were also closed in the area.[18] Damage in Mobile alone reached $25 million.[4] Rainfall was reported in seven other states, though no significant impact occurred.[19]
Tropical Storm Seven
| Tropical storm (SSHWS) | |
 | |
| Duration | October 2 – October 3 |
|---|---|
| Peak intensity | 60 mph (95 km/h) (1-min) 993 mbar (hPa) |
On September 25, a cold front emerged into the western Atlantic Ocean and stalled. An extratropical storm developed along the front on September 29 to the southeast of the Carolinas. The storm moved quickly east-northeastward and quickly intensified to near hurricane intensity. On September 30, the storm passed north of Bermuda, producing winds of 40 mph (65 km/h) there. On October 1, the system reversed its track, weakened slightly, and became more symmetric. By October 2, the strongest winds were located near the circulation center, based on nearby ship reports. Based on the observations, the Atlantic hurricane reanalysis project estimated that the system transitioned into a tropical storm on this day, although the storm could have been a subtropical cyclone. Around that time, maximum sustained winds were estimated at 60 mph (95 km/h). The storm moved to the north and northeast ahead of a cold front. On October 3, the front absorbed the storm.[12]
Hurricane Elena
| Category 2 hurricane (SSHWS) | |
 | |
| Duration | October 12 – October 19 |
|---|---|
| Peak intensity | 110 mph (175 km/h) (1-min) 977 mbar (hPa) |
TIROS imagery indicated a very weak circulation near 12°N, 40°W on October 11. Ship reports on the following day indicated a somewhat more organized circulation.[4] As a result, it is estimated that the final tropical depression of the season at 1200 UTC on October 12, while located about midway between Cape Verde and the Leeward Islands. Initially, the depression remained disorganized while tracking northwestward. However, by early on October 14, the depression strengthened into Tropical Storm Elena.[5] The storm continued to intensify and by early on October 16, a minimum pressure of 991 mbar (29.3 inHg).[4] Therefore, Elena likely reached hurricane status at 0600 UTC that day.[5] Later on October 16, the storm re-curved to the northeast and began to accelerate.[4] On October 18, Elena attained its peak intensity with maximum sustained winds of 110 mph (175 km/h) and a minimum barometric pressure of 977 mbar (28.9 inHg). At 0000 UTC on the following day,[5] the storm merged with an approaching cold front near the Azores.[4]
Tropical Storm Nine
| Tropical storm (SSHWS) | |
 | |
| Duration | October 16 – October 19 |
|---|---|
| Peak intensity | 65 mph (100 km/h) (1-min) 1004 mbar (hPa) |
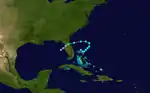
A trough persisted along the southeastern United States on October 15. A day later, a tropical depression formed along the trough near the northwestern Bahamas. The system quickly intensified into a tropical storm; due to its large circulation, the storm was potentially a subtropical cyclone. The storm moved in a counterclockwise direction – southeast at first, and eventually curving to the west-southwest. On October 18, the Hurricane Hunters flight reported maximum sustained winds of 65 mph (100 km/h). At 15:00 UTC that day, the storm made landfall at peak intensity near Flagler Beach, Florida. It quickly weakened while crossing the state, and dissipated the next day in the eastern Gulf of Mexico. The storm dropped rainfall across northeast Florida and neighboring Georgia. The storm, in conjunction with a high pressure system over New England, produced gale-force winds in the Carolinas.[12]
Tropical Storm Ten
| Tropical storm (SSHWS) | |
 | |
| Duration | November 29 – December 2 |
|---|---|
| Peak intensity | 50 mph (85 km/h) (1-min) 999 mbar (hPa) |
A cold front exited the east coast of the United States on November 22, and moved eastward. An extratropical storm developed along the front on November 26, located northeast of the Lesser Antilles. The storm moved northeastward, executed a small loop, and strengthened slightly. Gradually, the storm's structure became more symmetrical, and by November 29, the system transitioned into a tropical storm. At that time, the storm had peak winds of 50 mph (85 km/h), and was moving southward. On December 1, the storm weakened into a tropical depression, and on the same day, the track shifted to the west. On December 2, the depression dissipated.[12]
Storm names
The following names were used for named storms (tropical storms and hurricanes) that formed in the North Atlantic in 1965.[20] The name Betsy was later retired. Carol had been removed from the naming list for 10 years following Hurricane Carol of 1954. It was then retroactively retired because of the 1954 hurricane, not the storm in 1965.[21] They were replaced with Blanche and Camille for use in the 1969 season.[22] Names that were not assigned are marked in gray.
|
|
Season effects
The following table lists all of the storms that have formed in the 1965 Atlantic hurricane season. It includes their duration, names, landfall(s) (in parentheses), damages, and death totals. Deaths in parentheses are additional and indirect (an example of an indirect death would be a traffic accident), but were still related to that storm. Damage and deaths include totals while the storm was extratropical, a wave, or a low, and all of the damage figures are in 1965 USD.
| Saffir–Simpson scale | ||||||
| TD | TS | C1 | C2 | C3 | C4 | C5 |
| Storm name |
Dates active | Storm category
at peak intensity |
Max 1-min wind mph (km/h) |
Min. press. (mbar) |
Areas affected | Damage (USD) |
Deaths | Refs | ||
|---|---|---|---|---|---|---|---|---|---|---|
| One | June 13 – 15 | Tropical storm | 50 (85) | 1005 | Guatemala, Mexico, Southeastern United States | Minimal | None | |||
| Anna | August 21 – 25 | Category 2 hurricane | 105 (165) | 976 | None | None | None | |||
| Betsy | August 27 – September 12 | Category 4 hurricane | 140 (220) | 942 | Lesser Antilles, The Bahamas, United States Gulf Coast, Eastern United States | $1.43 billion | 76 | |||
| Four | September 7 – 9 | Tropical storm | 60 (95) | 991 | None | None | None | |||
| Carol | September 16 – 30 | Category 1 hurricane | 90 (150) | 974 | Azores | None | None | |||
| Debbie | September 24 – 30 | Tropical storm | 60 (95) | 993 | Honduras, Mexico, United States Gulf Coast | $25 million | None | |||
| Seven | October 2 – 3 | Tropical storm | 60 (95) | 993 | None | None | None | |||
| Elena | October 12 – 19 | Category 2 hurricane | 110 (175) | 977 | None | None | None | |||
| Nine | October 16 – 19 | Tropical storm | 65 (100) | 1004 | The Bahamas, Florida | Unknown | None | |||
| Ten | November 29 – December 2 | Tropical storm | 50 (85) | 999 | None | None | None | |||
| Season aggregates | ||||||||||
| 10 systems | June 13 – December 2 | 140 (220) | 942 | $1.68 billion | 76 | |||||
See also
- Atlantic hurricane season
- List of Atlantic hurricanes
- 1965 Pacific hurricane season
- 1965 Pacific typhoon season
References
- "Hurricane Season Of `65 Destructive". The Free Lance–Star. Associated Press. December 6, 1965. p. 2. Retrieved February 20, 2013.
- "Hurricane Watch Starts Today; Season Officially Open June 15". The Palm Beach Post. United Press International. June 1, 1964. p. 24. Retrieved February 20, 2013.
- Neal Dorst (January 21, 2010). Subject: G1) When is hurricane season ? (Report). Atlantic Oceanographic and Meteorological Laboratory. Retrieved February 20, 2013.
- Arnold L. Sugg (March 1966). The Hurricane Season of 1965 (PDF) (Report). National Hurricane Center. Retrieved March 12, 2012.
- "Atlantic hurricane best track (HURDAT version 2)" (Database). United States National Hurricane Center. May 25, 2020.
- Hurricane Research Division (March 2011). Atlantic basin Comparison of Original and Revised HURDAT (Report). National Oceanic and Atmospheric Administration. Retrieved 2013-02-13.
- David Levinson (2008-08-20). 2005 Atlantic Ocean Tropical Cyclones (Report). National Climatic Data Center. Retrieved 2013-02-13.
- Connor (June 14, 1965). Bulletin For Press, Radio, and TV. New Orleans Weather Bureau (Report). National Hurricane Center. Retrieved February 26, 2013.
- Roth, David M. (October 18, 2017). "Tropical Cyclone Point Maxima". Tropical Cyclone Rainfall Data. United States Weather Prediction Center. Retrieved November 26, 2017.
- John T. Connor. Storm Data and Unusual Weather Phenomena: September 1965 (PDF) (Report). National Climatic Data Center. pp. 116 and 119. Retrieved February 20, 2013.
- Costliest U.S. tropical cyclones tables updated (PDF) (Report). Miami, Florida: National Hurricane Center. January 26, 2018. Retrieved February 3, 2018.
- https://www.aoml.noaa.gov/hrd/hurdat/metadata-1961-1965.pdf
- Hurricane Carol Preliminary Report (Report). National Hurricane Center. 1965. p. 1. Retrieved October 29, 2012.
- Colon (September 19, 1965). "Tropical Storm Advisory Number 1". National Hurricane Center. Retrieved October 29, 2012.
- Hurricane Carol Preliminary Report (Report). National Hurricane Center. 1965. p. 2. Retrieved October 29, 2012.
- Arnold L. Sugg (September 25, 1965). Tropical Depression Advisory Number 1 Debbie. Miami Weather Bureau (Report). National Hurricane Center. Retrieved February 20, 2013.
- "15 Inches Rain in 15 Hours for Mobile". The Morning Record. Associated Press. October 1, 1965. Retrieved February 20, 2013.
- "Debbie Floods Mobile". Sarasota Herald-Tribune. United Press International. October 1, 1965. p. 1. Retrieved February 20, 2013.
- David M. Roth (April 12, 2009). Tropical Storm Debbie - September 26-October 1, 1965 (Report). Hydrometeorological Prediction Center. Retrieved February 20, 2013.
- ""Anna" Will Be First Hurricane". Youngstown Vindicator. Associated Press. May 23, 1965. p. 2. Retrieved February 20, 2013.
- Tropical Cyclone Naming History and Retired Names (Report). National Hurricane Center. April 13, 2012. Retrieved February 20, 2013.
- "We May Have To Grid For Gerda's Gusty Gales". St. Petersburg Times. June 2, 1969. p. 19. Retrieved February 20, 2013.