1975 Ontario general election
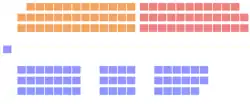
The 1975 Ontario general election was held on September 18, 1975, to elect the 125 members of the 30th Legislative Assembly of Ontario (Members of Provincial Parliament, or "MPPs") of the Province of Ontario, Canada.
| |||||||||||||||||||||||||||||||||||||||||
125 seats in the 30th Legislative Assembly of Ontario 63 seats were needed for a majority | |||||||||||||||||||||||||||||||||||||||||
|---|---|---|---|---|---|---|---|---|---|---|---|---|---|---|---|---|---|---|---|---|---|---|---|---|---|---|---|---|---|---|---|---|---|---|---|---|---|---|---|---|---|
| |||||||||||||||||||||||||||||||||||||||||
 | |||||||||||||||||||||||||||||||||||||||||
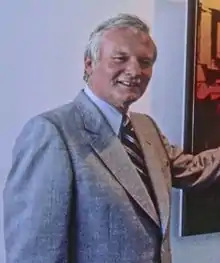
The Ontario Progressive Conservative Party, led by Bill Davis and campaigning under the slogan, "Your Future. Your choice.", won a tenth consecutive term in office. It lost its majority in the legislature, however, for the first time since the 1945 election. The PC Party lost 27 seats from its result in the previous election.
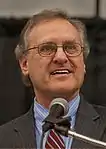
The social democratic Ontario New Democratic Party, led by Stephen Lewis with the slogan "Tomorrow starts today", doubled its representation in the legislature, and became the Official Opposition on the strength of a campaign which called for rent control in Ontario and highlighted horror stories of individuals and bad landlords who imposed exorbitant rent increases. The campaign forced the Davis' Tories to promise to implement rent controls shortly before the election.
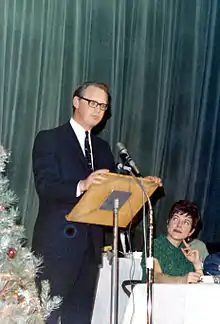
The Ontario Liberal Party, led by Robert Nixon, won 15 additional seats, but lost the role of Official Opposition to the NDP. One member of its caucus was elected as a Liberal-Labour candidate.
Results
| Party | Leader | 1971 | Elected | % change | Popular vote | ||
|---|---|---|---|---|---|---|---|
| % | change | ||||||
| Progressive Conservative | Bill Davis | 78 | 51 | -34.6% | 36.1% | -8.4% | |
| New Democratic | Stephen Lewis | 19 | 38 | +100% | 28.9% | +1.8% | |
| Liberal | Robert Nixon | 20 | 35 | +75.0% | 34.3% | +6.5% | |
| Liberal-Labour | - | 1 | - | - | - | ||
| Communist | William Stewart | - | - | - | - | - | |
| Total Seats | 117 | 125 | +6.8% | 100% | |||
There were also 12 Social Credit League of Ontario candidates but they were not officially recognized as such as the party did not run enough candidates or otherwise qualify for official party status under the newly passed Election Finances Reform Act, 1975.[1][2][3]
Partial Riding results
| Electoral District | Candidates | Incumbent | |||||||||
|---|---|---|---|---|---|---|---|---|---|---|---|
| PC | Liberal | NDP | Other | ||||||||
| Algoma | Bernt Gilbertson 4,588 (35.63%) |
Ralph Nelson 3,325 (25.83%) |
Bud Wildman 4,962 (38.54%) |
Bernt Gilbertson | |||||||
| Algoma—Manitoulin | John Lane 5,452 (40.71%) |
Leo A Foucault 3,589 (26.80%) |
Winston Baker 4,352 (32.49%) |
John Lane | |||||||
| Armourdale | Mel Lastman 12,100 (35.93%) |
Philip Givens 14,739 (43.77%) |
M Mocciola 6,255 (18.57%) |
David Liddiard (Ind) 583 (1.73%) |
Gordon Carton | ||||||
| Beaches—Woodbine | Tom Wardle 7,850 (34.15%) |
Ken Kory 4,461 (19.40%) |
Marion Bryden 10,500 (45.67%) |
C Negre (Comm) 178 (0.77%) |
Tom Wardle | ||||||
| Bellwoods | Elio Madonia 3,249 (25.19%) |
Millie Caccia 4,482 (34.75%) |
Ross McClellan 4,921 (38.15%) |
RJ Orlandini (Comm) 247 (1.91%) |
John Yaremko | ||||||
| Brampton | Bill Davis 16,555 (43.76%) |
Bill Agnew 9,906 (26.19%) |
John Deamer 10,793 (28.53%) |
AR Bullock (SC) 258 (0.68%) Robert Simms (Ind) 165 (0.44%) J MacLennan (Comm) 152 (0.40%) |
Bill Davis | ||||||
| Brantford | Richard B. Beckett 9,001 (29.17%) |
David Carll 9,689 (31.40%) |
Mac Makarchuk 12,048 (39.05%) |
WP Small (Comm) 115 (0.37%) |
Dick Beckett | ||||||
| Brant—Oxford—Haldimand | Don Harder 6,572 (25.18%) |
Robert Nixon 14,379 (55.09%) |
Jim Schneider 4,791 (18.36%) |
A Kerr 357 (1.37%) |
Robert Nixon | ||||||
| Brock | Bob Welch 12,790 (52.28%) |
Margo Fyfe 5,704 (23.32%) |
Fred Lindal 5,969 (24.40%) |
Bob Welch | |||||||
| Burlington South | George Kerr 16,761 (45.49%) |
Don Pennell 11,278 (30.61%) |
Bill Brown 8,808 (23.90%) |
John Lawson (Lbt) 615 (1.66%) |
George Kerr | ||||||
| Cambridge | Ruggles Constant 8,666 (29.04%) |
Claudette Millar 9,772 (32.75%) |
Monty Davidson 11,399 (38.20%) |
New District | |||||||
| Carleton | Sid Handleman 12,867 (39.29%) |
Ben Franklin 12,023 (36.72%) |
Bill Brown 8,808 (23.90%) |
Sid Handleman | |||||||
| Carleton East | Darwin Kealey 9,506 (28.58%) |
Paul Taylor 11,776 (35.40%) |
Evelyn Gigantes 11,981 (36.02%) |
Paul Taylor | |||||||
| Carleton-Grenville | Donald Irvine 12,275 (53.32%) |
Howard Perkins 5,006 (21.74%) |
Reg Willis 5,741 (24.94%) |
Donald Irvine | |||||||
| Chatham—Kent | Darcy McKeough 10,146 (43.69%) |
Jim Cooke 7,347 (31.64%) |
Ron Franko 5,728 (24.67%) |
Darcy McKeough | |||||||
| Cochrane North | René Brunelle 9,650 (61.17%) |
Bernie Labonte 2,398 (15.20%) |
René Brixhe 3,728 (23.63%) |
René Brunelle | |||||||
| Cochrane South | Alan Pope 9,787 (42.31%) |
Wayne Keon 2,243 (9.70%) |
Bill Ferrier 10,784 (46.62%) |
Robert Cochrane (SC) 198 (0.86%) Peter Bruce (Ind) 119 (0.51%) |
Bill Ferrier | ||||||
| Cornwall | Rudy Villeneuve 9,246 (39.62%) |
Madeleine Germain 2,162 (9.27%) |
George Samis 11,927 (51.11%) |
George Samis | |||||||
| Don Mills | Dennis Timbrell 13,873 (46.35%) |
Donald Wright 7,845 (26.21%) |
Bob Sherwood 8,216 (27.45%) |
Dennis Timbrell | |||||||
| Dovercourt | George Nixon 4,385 (31.92%) |
Agosto Venier 3,013 (21.93%) |
Tony Lupusella 5,748 (41.84%) |
William Stewart (Comm) 500 (3.64%) Hugh Yearweood (Ind) 91 (0.66%) |
George Nixon | ||||||
| Downsview | Barbara Greene 5,832 (26.65%) |
Michael Spensieri 7,962 (36.38%) |
Odoardo Di Santo 8,090 (36.97%) |
Vern Singer | |||||||
| Dufferin—Simcoe | George McCague 13,130 (45.94%) |
Bob Beattie 11,539 (40.37%) |
Ian Perkins 3,317 (11.61%) |
R Cornelsen (SC) 596 (2.09%) |
George McCague | ||||||
| Durham East | Charles McIlveen 10,782 (41.66%) |
Kirk Entwisle 6,697 (21.91%) |
Doug Moffatt 12,824 (41.96%) |
Ray Beacock (SC) 258 (0.84%) |
Charles McIlveen | ||||||
| Durham North | Bill Newman 11,226 (39.41%) |
Clare W Morrison 11,071 (38.86%) |
Lesley Griffin 6,189 (21.73%) |
Bill Newman | |||||||
| Durham West | Bill Pilkington 7,675 (26.05%) |
Des Newman 10,104 (34.29%) |
Charles Godfrey 11,539 (39.16%) |
Ray Beacock (SC) 258 (0.84%) |
New District | ||||||
| Eglinton | Roy McMurtry 17,264 (52.30%) |
Frank Judge 10,492 (31.79%) |
Eileen Elmy 4,713 (14.28%) |
Ann Harris (SC) 288 (0.87%) Donald Redekop (Ind) 252 (0.76%) |
Leonard Reilly | ||||||
| Elgin | Ron McNeil 11,940 (44.02%) |
Marietta Roberts 10,078 (37.16%) |
Bob McNaughton 5,104 (18.82%) |
Ron McNeil | |||||||
| Erie | John Buscarino 4,646 (22.40%) |
Ray Haggerty 9,185 (44.29%) |
Maurice Keck 6,906 (33.30%) |
Ray Haggerty | |||||||
| Essex North | Fred Cada 4,451 (20.53%) |
Dick Ruston 9,550 (44.05%) |
Lucien Lacasse 7,678 (35.42%) |
Dick Ruston | |||||||
| Essex South | Frank Klees 7,378 (32.11%) |
Remo Mancini 9,543 (41.53%) |
Ralph Wensley 6,058 (26.36%) |
Remo Mancini | |||||||
| Etobicoke | Bill Stockwell 7,134 (29.87%) |
Leonard Braithwaite 7,758 (32.48%) |
Ed Philip 8,995 (37.66%) |
Leonard Braithwaite | |||||||
| Fort William | Jim Jessiman 8,216 (32.77%) |
Dale Willoughby 7,449 (29.72%) |
Iain Angus 9,173 (36.59%) |
Clifford Wahl (Comm) 230 (0.92%) |
Jim Jessiman | ||||||
| Frontenac—Addington | Wilmer John Nuttall 8,889 (38.34%) |
J. Earl McEwen 10,380 (44.77%) |
Bill Barnes 3,379 (14.57%) |
Ross Baker (Ind) 539 (2.32%) |
W J Nuttall | ||||||
| Grey | Eric Winkler 11,349 (43.95%) |
Bob McKessock 11,637 (45.07%) |
Colin L Swan 2,835 (10.98%) |
Eric A Winkler | |||||||
| Grey-Bruce | Gary Harron 8,288 (34.73%) |
Eddie Sargent 14,339 (60.09%) |
Lorne Creighton 1,235 (5.18%) |
Eddie Sargent | |||||||
| Haldimand-Norfolk | James N Allan 12,260 (39.06%) |
Gordon Miller 14,161 (45.12%) |
Norm Walpole 4,967 (15.82%) |
James N Allan | |||||||
| Halton—Burlington | Gary Dawkins 10,543 (37.30%) |
Julian Reed 11,076 (39.19%) |
Bill Johnson 6,644 (23.51%) |
New Riding | |||||||
| Hamilton Centre | Maurice C Carter 5,871 (25.51%) |
Bob Monte 8,138 (35.36%) |
Mike Davison 8,778 (38.14%) |
Art Walling (Comm) 226 (0.98%) |
Norm Davison | ||||||
| Hamilton East | Bob Hodgson 6,197 (21.21%) |
Joe Rogers 8,425 (28.84%) |
Robert W. Mackenzie 13,971 (47.83%) |
Bob Jaggard (Comm) 411 (1.41%) Alcide Hamelin (SC) 207 (0.71%) |
Reg Gisborn | ||||||
| Hamilton Mountain | John Smith 12,668 (38.63%) |
Ray C Edwards 8,869 (27.04%) |
Brian Charlton 11,075 (33.77%) |
Mike Mirza (Comm) 185 (0.56%) |
John Smith | ||||||
| Hamilton West | Bob Morrow 10,233 (36.27%) |
Stuart Smith 10,737 (38.06%) |
Ray Fazakas 7,243 (25.67%) |
Jack McNie | |||||||
| Hastings-Peterborough | Clarke Rollins 10,679 (47.19%) |
Dave Hobson 8,664 (38.28%) |
Bob Thompson 2,961 (13.08%) |
Nancy Arnold 328 (1.45%) |
Clarke Rollins | ||||||
| High Park—Swansea | Yuri Shymko 8,442 (33.04%) |
Ed Negridge 6,440 (25.21%) |
Ed Ziemba 10,215 (39.98%) |
Steve Amsel (Comm) 234 (0.91%) Ann Noble (Ind) 217 (0.85%) |
Morton Shulman | ||||||
| Humber | John MacBeth 17,576 (44.36%) |
Alex Marchetti 14,408 (36.36%) |
Bob Curran 7,639 (19.28%) |
John MacBeth | |||||||
| Huron-Bruce | W E Walden 5,955 (23.68%) |
Murray Gaunt 16,561 (65.85%) |
Donald Milne 2,635 (10.48%) |
Murray Gaunt | |||||||
| Huron—Middlesex | Jim Hayter 8,010 (36.72%) |
Jack Riddell 11,837 (54.26%) |
Paul Carroll 1,967 (9.02%) |
Jack Riddell | |||||||
| Kenora | Leo Bernier 8,907 (52.34%) |
Fred Porter 2,945 (17.31%) |
Bill Watkins 5,165 (30.35%) |
Leo Bernier | |||||||
| Kent—Elgin | Don Luckham 7,561 (33.46%) |
Jack Spence 12,793 (56.62%) |
Ray McGaffey 2,242 (9.92%) |
Jack Spence | |||||||
| Kingston and the Islands | Keith Norton 9,386 (37.54%) |
Ken Keyes 9,270 (37.08%) |
Lars Thompson 6,134 (24.54%) |
Ruth Miller (Comm) 209 (0.84%) |
Syl Apps | ||||||
See also
References
- 725 seats in legislature: Record 454 candidates nominated for 125 Ontario seats The Globe and Mail (1936-Current); Sep 5, 1975; ProQuest Historical Newspapers: The Globe and Mail pg. 40
- Elected: PCs, 51; NDP, 38; Lib, 36: AFTER 30 YEARS, TORY MINORITY Lewis will head official Opposition Williamson, Robert. The Globe and Mail (1936-Current); Toronto, Ont. [Toronto, Ont]19 Sep 1975: C1.
- Leader didn't know: Socreds don't qualify as a party for election The Globe and Mail (1936-Current); Aug 14, 1975; ProQuest Historical Newspapers: The Globe and Mail pg. 4
| General elections | |
|---|---|
| By-elections | |
| Referendums | |