Kingston and the Islands (provincial electoral district)
Kingston and the Islands is a provincial electoral district in Ontario, Canada, that has been represented in the Legislative Assembly of Ontario since 1967.
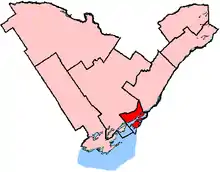 Kingston and the Islands shown within the Eastern Ontario region | |||
| Provincial electoral district | |||
| Legislature | Legislative Assembly of Ontario | ||
| MPP |
New Democratic | ||
| District created | 1966 | ||
| First contested | 1967 | ||
| Last contested | 2018 | ||
| Demographics | |||
| Population (2006) | 119,069 | ||
| Electors (2011) | 96,955 | ||
| Area (km²) | 676 | ||
| Pop. density (per km²) | 176.1 | ||
| Census division(s) | Frontenac | ||
| Census subdivision(s) | Frontenac Islands, Kingston | ||
It covers the city of Kingston, Ontario and the nearby areas, including the sparsely populated Frontenac Islands in the St. Lawrence River.
Demographics
- Average family income: $68,494[1] (2001)
- Median household income: $46,310[2]
- Unemployment: 7.4%
- Language, Mother Tongue: English 84%, French 3%, Other 13%
- Religion: Protestant 44%, Catholic 33%, Orthodox Christian 1%, Other Christian 2%, Muslim 1%, Jewish 1%, Non Religious Affiliation 18%, Other 1%[3]
- Visible Minority: Black 1%, Chinese 1%, South Asian 1%, Others 2%
Boundaries
The riding was created before the 1967 provincial election. Its initial area consisted of the townships of Amherst Island, Howe Island and Wolfe Island, the city of Kingston and the islands in the St. Lawrence River within the county of Frontenac.[4] In 1986, it was changed slightly to include Kingston and the three major islands plus all the land south of Highway 401 within the township of Pittsburgh.[5]
In 1996, the provincial government reduced the number of ridings in the province from 130 to 103. They also directed the new ridings to correspond to the boundaries of the existing federal ridings.[6] At that time, the federal counterpart, Kingston and the Islands, existed with the same boundaries as the current provincial riding. After the 1999 election, minor changes to the riding were made along with the federal counterpart in 2003 and 2013.[7]
Members of Provincial Parliament
| Kingston and the Islands | ||||
|---|---|---|---|---|
| Assembly | Years | Member | Party | |
| Riding created from Kingston | ||||
| 28th | 1967–1971 | Syl Apps | Progressive Conservative | |
| 29th | 1971–1975 | |||
| 30th | 1975–1977 | Keith Norton | ||
| 31st | 1977–1981 | |||
| 32nd | 1981–1985 | |||
| 33rd | 1985–1987 | Ken Keyes | Liberal | |
| 34th | 1987–1990 | |||
| 35th | 1990–1995 | Gary Wilson | New Democratic | |
| 36th | 1995–1999 | John Gerretsen | Liberal | |
| 37th | 1999–2003 | |||
| 38th | 2003–2007 | |||
| 39th | 2007–2011 | |||
| 40th | 2011–2014 | |||
| 41st | 2014–2018 | Sophie Kiwala | ||
| 42nd | 2018–Present | Ian Arthur | New Democratic | |
| Sourced from the Ontario Legislative Assembly[8] | ||||
Election results
| 2018 Ontario general election: Kingston and the Islands | ||||||||
|---|---|---|---|---|---|---|---|---|
| Party | Candidate | Votes | % | ±% | ||||
| New Democratic | Ian Arthur | 21,788 | 39.16 | +9.60 | ||||
| Liberal | Sophie Kiwala | 15,312 | 27.52 | -14.07 | ||||
| Progressive Conservative | Gary Bennett | 14,512 | 26.08 | +4.82 | ||||
| Green | Robert Kiley | 3,574 | 6.42 | -0.68 | ||||
| Libertarian | Heather Cunningham | 274 | 0.49 | |||||
| Trillium | Andre Imbeault | 184 | 0.33 | |||||
| Total valid votes | 100.00 | |||||||
| Eligible voters | 94,160 | |||||||
| New Democratic gain from Liberal | Swing | +11.64 | ||||||
| Source: Elections Ontario[9] | ||||||||
| 2014 Ontario general election | ||||||||
|---|---|---|---|---|---|---|---|---|
| Party | Candidate | Votes | % | ±% | ||||
| Liberal | Sophie Kiwala | 20,838 | 41.59 | −7.25 | ||||
| New Democratic | Mary Rita Holland | 14,811 | 29.56 | +5.77 | ||||
| Progressive Conservative | Mark Bain | 10,652 | 21.26 | −1.06 | ||||
| Green | Robert Kiley | 3,556 | 7.10 | +3.40 | ||||
| Freedom | Jonathan Reid | 242 | 0.48 | +0.32 | ||||
| Total valid votes | 50,099 | 100.0 | ||||||
| Liberal hold | Swing | −6.51 | ||||||
Source(s)
Elections Ontario (2014). "Official result from the records, 036 Kingston and the Islands" (PDF). Retrieved 27 June 2015. | ||||||||
| 2011 Ontario general election | ||||||||
|---|---|---|---|---|---|---|---|---|
| Party | Candidate | Votes | % | ±% | Expenditures | |||
| Liberal | John Gerretsen | 21,028 | 48.84 | +1.61 | $ 71,020.00 | |||
| New Democratic | Mary Rita Holland | 10,241 | 23.79 | +3.24 | 34,982.21 | |||
| Progressive Conservative | Rodger James | 9,610 | 22.32 | – | 45,336.00 | |||
| Green | Robert Kiley | 1,594 | 3.70 | −5.07 | 15,086.56 | |||
| Family Coalition | David Caracciolo | 336 | 0.78 | −0.07 | 2,857.71 | |||
| Libertarian | Jamie Shaw | 115 | 0.27 | 0.00 | ||||
| Freedom | Paul Busch | 71 | 0.16 | −0.12 | 0.00 | |||
| Republican | David Best | 56 | 0.13 | 0.00 | ||||
| Total valid votes / Expense limit | 43,051 | 100.0 | −12.65 | $ 114,204.30 | ||||
| Total rejected, unmarked and declined ballots | 163 | 0.38 | −0.20 | |||||
| Turnout | 43,214 | 45.03 | −8.93 | |||||
| Eligible voters | 95,966 | +4.47 | ||||||
| Liberal hold | Swing | −0.82 | ||||||
Source(s)
"Official return from the records / Rapport des registres officiels - Kingston and the Islands" (PDF). Retrieved June 1, 2014. "2011 Candidate Campaign Returns (CR-1)". Elections Ontario. Retrieved June 2, 2014. | ||||||||
| 2007 Ontario general election | ||||||||
|---|---|---|---|---|---|---|---|---|
| Party | Candidate | Votes | % | ±% | Expenditures | |||
| Liberal | John Gerretsen | 23,277 | 47.23 | −13.05 | $ 64,512.47 | |||
| Progressive Conservative | John Rapin | 11,001 | 22.32 | +2.20 | 69,700.00 | |||
| New Democratic | Rick Downes | 10,129 | 20.55 | +9.04 | 56,689.54 | |||
| Green | Bridget Doherty | 4,321 | 8.77 | +2.22 | 13,098.54 | |||
| Family Coalition | Chris Beneteau | 419 | 0.85 | −0.68 | 0.00 | |||
| Freedom | Mark Fournier | 137 | 0.28 | 0.00 | ||||
| Total valid votes/Expense limit | 49,284 | 100.0 | +2.88 | $ 99,207.72 | ||||
| Total rejected ballots | 286 | 0.58 | +0.12 | |||||
| Turnout | 49,570 | 53.96 | −0.33 | |||||
| Eligible voters | 91,859 | +3.64 | ||||||
Source(s) | ||||||||
| 2003 Ontario general election | ||||||||
|---|---|---|---|---|---|---|---|---|
| Party | Candidate | Votes | % | ±% | Expenditures | |||
| Liberal | John Gerretsen | 28,877 | 60.28 | +5.58 | $ 57,119.88 | |||
| Progressive Conservative | Hans Westenberg | 9,640 | 20.12 | −9.94 | 43,307.95 | |||
| New Democratic | Janet C. Collins | 5,514 | 11.51 | +0.23 | 23,161.12 | |||
| Green | Eric B. Walton | 3,137 | 6.55 | +4.11 | 19,292.20 | |||
| Family Coalition | Chris K. Beneteau | 735 | 1.53 | +0.40 | 551.01 | |||
| Total valid votes/Expense limit | 47,903 | 100.0 | −0.57 | $ 85,086.72 | ||||
| Total rejected ballots | 219 | 0.46 | −0.25 | |||||
| Turnout | 48,122 | 54.29 | −0.22 | |||||
| Eligible voters | 88,634 | −0.43 | ||||||
| 1999 Ontario general election | ||||||||
|---|---|---|---|---|---|---|---|---|
| Party | Candidate | Votes | % | ±% | Expenditures | |||
| Liberal | John Gerretsen | 26,355 | 54.70 | +17.80 | $ 40,703.00 | |||
| Progressive Conservative | Bob Pickering | 14,487 | 30.07 | −0.60 | 65,682.63 | |||
| New Democratic | Beth Pater | 5,436 | 11.28 | −17.53 | 26,106.42 | |||
| Green | Chris Walker | 1,174 | 2.44 | 4,848.00 | ||||
| Family Coalition | Chris K. Beneteau | 546 | 1.13 | −1.94 | 15.00 | |||
| Natural Law | Gerard Morris | 182 | 0.38 | −0.17 | 0.00 | |||
| Total valid votes/Expense limit | 48,180 | 100.0 | +72.38 | $ 85,460.16 | ||||
| Total rejected ballots | 345 | 0.71 | −0.09 | |||||
| Turnout | 48,525 | 54.51 | −6.57 | |||||
| Eligible voters | 89,021 | +93.00 | ||||||
| 1995 Ontario general election | ||||||||
|---|---|---|---|---|---|---|---|---|
| Party | Candidate | Votes | % | ±% | Expenditures | |||
| Liberal | John Gerretsen | 10,314 | 36.90 | +6.71 | $ 33,086.00 | |||
| Progressive Conservative | Sally Barnes | 8,571 | 30.67 | +4.26 | 40,705.44 | |||
| New Democratic | Gary Wilson | 8,052 | 28.81 | −9.18 | 30,908.12 | |||
| Family Coalition | John Pacheco | 858 | 3.07 | −2.34 | 6,044.53 | |||
| Natural Law | Ronald Dunphy | 155 | 0.55 | 0.00 | ||||
| Total valid votes/Expense limit | 27,950 | 100.0 | −4.26 | $ 45,281.00 | ||||
| Total rejected ballots | 225 | 0.80 | ||||||
| Turnout | 28,175 | 61.08 | ||||||
| Eligible voters | 46,125 | |||||||
Source(s)
"General Election of June 8 1995 – Summary of Valid Ballots by Candidate". Retrieved June 2, 2014. "General Election of June 8 1995 – Statistical Summary". Elections Ontario. "1995 Details of Candidate Income and Expenses" (3.16MB). & "1995 Summary of Income and Campaign Expenses" ( | ||||||||
| 1990 Ontario general election | ||||||||
|---|---|---|---|---|---|---|---|---|
| Party | Candidate | Votes | % | ±% | ||||
| New Democratic | Gary Wilson | 10,184 | 37.99 | +13.33 | ||||
| Liberal | Ken Keyes | 8,092 | 30.19 | −20.42 | ||||
| Progressive Conservative | John Goodchild | 7,079 | 26.41 | +3.65 | ||||
| Family Coalition | Joan Jackson | 1,452 | 5.41 | |||||
| Total valid votes | 26,807 | 100.0 | +3.25 | |||||
| 1987 Ontario general election | ||||||||
|---|---|---|---|---|---|---|---|---|
| Party | Candidate | Votes | % | ±% | ||||
| Liberal | Ken Keyes | 13,141 | 50.61 | +4.28 | ||||
| New Democratic | Gary Wilson | 6,402 | 24.66 | +9.54 | ||||
| Progressive Conservative | Tom Annis | 5,910 | 22.76 | −14.68 | ||||
| Green | Steven Kaasgaard | 511 | 1.97 | +0.86 | ||||
| Total valid votes | 25,964 | 100.0 | +0.88 | |||||
| 1985 Ontario general election | ||||||||
|---|---|---|---|---|---|---|---|---|
| Party | Candidate | Votes | % | ±% | ||||
| Liberal | Ken Keyes | 11,924 | 46.33 | +12.39 | ||||
| Progressive Conservative | Keith Norton | 9,637 | 37.44 | −12.63 | ||||
| New Democratic | Pamela Cross | 3,892 | 15.12 | −0.87 | ||||
| Green | Don Irvine | 285 | 1.11 | |||||
| Total valid votes | 25,738 | 100.0 | +3.20 | |||||
| 1981 Ontario general election | ||||||||
|---|---|---|---|---|---|---|---|---|
| Party | Candidate | Votes | % | ±% | ||||
| Progressive Conservative | Keith Norton | 12,488 | 50.07 | −2.25 | ||||
| Liberal | Carl Ross | 8,465 | 33.94 | +6.21 | ||||
| New Democratic | Ron Murray | 3,987 | 15.99 | −3.28 | ||||
| Total valid votes | 24,940 | 100.0 | +6.56 | |||||
| 1977 Ontario general election | ||||||||
|---|---|---|---|---|---|---|---|---|
| Party | Candidate | Votes | % | ±% | ||||
| Progressive Conservative | Keith Norton | 12,246 | 52.32 | +14.78 | ||||
| Liberal | Peter Watson | 6,490 | 27.73 | -9.35 | ||||
| New Democratic | John Clements | 4,510 | 19.27 | -5.27 | ||||
| Communist | Louise Andrews | 158 | 0.68 | -0.16 | ||||
| Total valid votes | 23,404 | 100.0 | ||||||
| 1975 Ontario general election | ||||||||
|---|---|---|---|---|---|---|---|---|
| Party | Candidate | Votes | % | |||||
| Progressive Conservative | Keith Norton | 9,386 | 37.54 | |||||
| Liberal | Ken Keyes | 9,270 | 37.08 | |||||
| New Democratic | Lars Thompson | 6,134 | 24.54 | |||||
| Communist | Ruth Miller | 209 | 0.84 | |||||
| Total valid votes | 24,999 | 100.0 | ||||||
2007 electoral reform referendum
| 2007 Ontario electoral reform referendum | |||
|---|---|---|---|
| Side | Votes | % | |
| First Past the Post | 26,473 | 54.6 | |
| Mixed member proportional | 21,968 | 45.4 | |
| Total valid votes | 48,431 | 100.0 | |
References
- "143 Kingston and the Islands". Canada Votes. CBC.ca. Archived from the original on 16 June 2004. Retrieved 30 March 2015.
- "Election 2006". CTV.ca. Retrieved 2 September 2010.
- "Federal Electoral District Profile of Kingston and the Islands - Kingston et les Îles, Ontario (2003 Representation Order), 2001 Census Map". 2001 Census. Statistics Canada. Retrieved 2 September 2010.
- "Representation Act , RSO 1970, c 413". Legislative Assembly of Ontario. 1970. p. 21.
- "Representation Act, 1986, SO 1986, c 30". Legislative Assembly of Ontario. January 6, 1986. p. 367.
- "C 28: Fewer Politicians Act, 1996". Legislative Assembly of Ontario. December 9, 1996.
- "History of Federal Ridings Since 1867: Kingston and the Islands, Ontario, (1968-)". Parliament of Canada. 2017.
- For a listing of each MPP's Queen's Park curriculum vitae see below:
- For Syl Apps's Legislative Assembly information see "Syl Apps, MPP". Parliamentary History. Toronto: Legislative Assembly of Ontario. 2017.
- For Keith Norton's Legislative Assembly information see "Keith Norton, MPP". Parliamentary History. Toronto: Legislative Assembly of Ontario. 2017.
- For Ken Keyes's Legislative Assembly information see "Ken Keyes, MPP". Parliamentary History. Toronto: Legislative Assembly of Ontario. 2017.
- For Gary Wilson's Legislative Assembly information see "Gary Wilson, MPP". Parliamentary History. Toronto: Legislative Assembly of Ontario. 2017.
- For John Gerretsen's Legislative Assembly information see "John Gerretsen, MPP". Parliamentary History. Toronto: Legislative Assembly of Ontario. 2017.
- For Sophie Kiwala's Legislative Assembly information see "Sophie Kiwala, MPP". Parliamentary History. Toronto: Legislative Assembly of Ontario. 2017.
- "Summary of Valid Votes Cast for each Candidate" (PDF). Elections Ontario. Retrieved 16 January 2019.