1979 Vincentian general election
General elections were held in Saint Vincent and the Grenadines on 5 December 1979.[1] The result was a victory for the Saint Vincent Labour Party (SVLP), which won eleven of the thirteen seats. Voter turnout was 63.9%.[2]
| |||||||||||||||||||||||||||||||
13 seats in the House of Assembly 7 seats needed for a majority | |||||||||||||||||||||||||||||||
|---|---|---|---|---|---|---|---|---|---|---|---|---|---|---|---|---|---|---|---|---|---|---|---|---|---|---|---|---|---|---|---|
| Turnout | 63.9% ( | ||||||||||||||||||||||||||||||
| |||||||||||||||||||||||||||||||
 Results by constituency | |||||||||||||||||||||||||||||||
| |||||||||||||||||||||||||||||||

Campaign
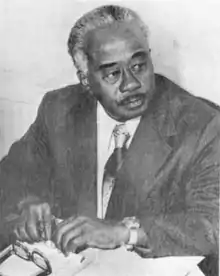
Fifty candidates contested the 13 seats from four parties. The SVLP led by Milton Cato, Prime Minister since 1974; the People's Political Party (PPP), the SVLP's traditional rival, headed by Ebenezer Joshua; the New Democratic Party, led by James Fitz-Allen Mitchell; and the United People's Movement of Ralph Gonsalves, which contested elections for the first time. All four groups presented a similar manifesto but ideologically the United People's Movement was oriented to the left much as the political groups which had recently come to power in Grenada and Saint Lucia. The SVLP (considered a moderate socialist party), the centrist New Democratic Party and the People's Political Party were oriented to the right.[3]
Results
On polling day, the SVLP obtained a clear victory as it captured 11 of the 13 seats. The other two seats went to New Democratic Party candidates although the NDP leader, James Mitchell, was himself defeated. Voter turnout was 63.9%, up only slightly from 63.2% in 1974.
| Party | Votes | % | Seats | +/– | |
|---|---|---|---|---|---|
| Saint Vincent Labour Party | 17,876 | 54.24 | 11 | +1 | |
| New Democratic Party | 9,022 | 27.38 | 2 | New | |
| United People's Movement | 4,467 | 13.55 | 0 | New | |
| People's Political Party | 1,492 | 4.53 | 0 | –2 | |
| Independents | 98 | 0.30 | 0 | New | |
| Total | 32,955 | 100.00 | 13 | 0 | |
| Valid votes | 32,955 | 99.04 | |||
| Invalid/blank votes | 321 | 0.96 | |||
| Total votes | 33,276 | 100.00 | |||
| Registered voters/turnout | 52,073 | 63.90 | |||
| Source: Nohlen | |||||
By constituency
| Constituency | Registered voters |
Party | Votes | ||||||||||||
|---|---|---|---|---|---|---|---|---|---|---|---|---|---|---|---|
| SVLP | NDP | UPM | PPP | Independents | Valid | Invalid | Total | Turnout | |||||||
| Votes | % | Votes | % | Votes | % | Votes | % | Votes | % | ||||||
| North Windward | 2,943 | 718 | 35.5 | 566 | 28.0 | 268 | 13.3 | 362 | 17.9 | 98 | 4.9 | 2,012 | 8 | 2,020 | 68.6 |
| North Central Windward | 4,582 | 1,725 | 56.1 | 633 | 20.6 | 582 | 18.9 | 115 | 3.7 | – | – | 3,055 | 19 | 3,074 | 67.1 |
| South Central Windward | 3,569 | 1,006 | 44.1 | 658 | 28.8 | 383 | 16.8 | 226 | 9.9 | – | – | 2,273 | 10 | 2,283 | 64.0 |
| South Windward | 3,475 | 1,391 | 59.5 | 611 | 26.1 | 305 | 13.0 | – | – | – | – | 2,307 | 32 | 2,339 | 67.3 |
| Marriaqua | 3,527 | 1,807 | 82.1 | 229 | 10.4 | 135 | 6.1 | 12 | 0.5 | – | – | 2,183 | 18 | 2,201 | 62.4 |
| East St. George | 4,350 | 1,962 | 74.0 | 416 | 15.7 | 237 | 8.9 | 15 | 0.6 | – | – | 2,630 | 22 | 2,652 | 61.0 |
| West St. George | 4,815 | 1,608 | 55.7 | 322 | 11.2 | 419 | 14.5 | 510 | 17.7 | – | – | 2,859 | 26 | 2,885 | 59.9 |
| East Kingstown | 4,425 | 1,369 | 56.3 | 478 | 19.7 | 468 | 19.3 | 81 | 3.3 | – | – | 2,396 | 34 | 2,430 | 54.9 |
| West Kingstown | 4,404 | 1,586 | 63.4 | 514 | 20.5 | 379 | 15.1 | – | – | – | – | 2,479 | 24 | 2,503 | 56.8 |
| South Leeward | 4,740 | 1,678 | 51.6 | 989 | 30.4 | 491 | 15.1 | 28 | 0.9 | – | – | 3,186 | 63 | 3,249 | 68.5 |
| Central Leeward | 3,160 | 1,360 | 60.6 | 291 | 13.0 | 553 | 24.7 | 22 | 1.0 | – | – | 2,226 | 17 | 2,243 | 71.0 |
| North Leeward | 4,253 | 1,384 | 44.5 | 1,448 | 46.6 | 247 | 7.9 | 15 | 0.5 | – | – | 3,094 | 16 | 3,110 | 73.1 |
| Grenadines | 3,830 | 282 | 12.3 | 1,867 | 81.6 | – | – | 106 | 4.6 | – | – | 2,255 | 32 | 2,287 | 59.7 |
| Total | 52,073 | 17,876 | 54.2 | 9,022 | 27.4 | 4,467 | 13.6 | 1,492 | 4.5 | 98 | 0.3 | 32,955 | 321 | 33,276 | 63.9 |
References
- Dieter Nohlen (2005) Elections in the Americas: A data handbook, Volume I, p600 ISBN 978-0-19-928357-6
- Nohlen, p603
- "General Election Results - 5 December 1979". Caribbean Elections. Retrieved 1 December 2017.