1983 Basque foral elections
The 1983 Basque foral elections were held on Sunday, 8 May 1983, to elect the 2nd Juntas Generales of Álava, Biscay and Gipuzkoa. All 153 seats in the three Juntas Generales were up for election. The elections were held simultaneously with regional elections in thirteen autonomous communities and local elections all throughout Spain.
Overall
| Parties and coalitions | Popular vote | Seats | ||||
|---|---|---|---|---|---|---|
| Votes | % | ±pp | Total | +/− | ||
| Basque Nationalist Party (EAJ/PNV) | 395,885 | 39.56 | +2.38 | 74 | –25 | |
| Socialist Party of the Basque Country (PSE–PSOE) | 263,436 | 26.32 | +10.99 | 39 | +7 | |
| Popular Unity (HB) | 142,481 | 14.24 | –3.72 | 20 | –18 | |
| People's Coalition (AP–PDP–UL)1 | 88,086 | 8.80 | +8.75 | 14 | +14 | |
| Basque Country Left (EE) | 79,158 | 7.91 | +0.75 | 6 | –8 | |
| Communist Party of the Basque Country (PCE/EPK) | 20,390 | 2.04 | –2.43 | 0 | –3 | |
| Democratic and Social Centre (CDS) | 3,175 | 0.32 | New | 0 | ±0 | |
| Llodian Independent Group (AILL) | 741 | 0.07 | ±0.00 | 0 | ±0 | |
| Communist League–Internationalist Socialist Workers' Coalition (LC (COSI)) | 724 | 0.07 | New | 0 | ±0 | |
| Revolutionary Communist League (LKI/LCR) | 645 | 0.06 | –0.61 | 0 | ±0 | |
| Union of the Democratic Centre (UCD) | n/a | n/a | –11.90 | 0 | –32 | |
| Independents (INDEP) | n/a | n/a | –1.98 | 0 | –10 | |
| Blank ballots | 6,004 | 0.60 | +0.14 | |||
| Total | 1,000,725 | 153 | –75 | |||
| Valid votes | 1,000,725 | 98.76 | +0.07 | |||
| Invalid votes | 12,577 | 1.24 | –0.07 | |||
| Votes cast / turnout | 1,013,302 | 64.59 | +2.72 | |||
| Abstentions | 555,505 | 35.41 | –2.72 | |||
| Registered voters | 1,568,807 | |||||
| Sources[1][2] | ||||||
Foral deputation control
The following table lists party control in the foral deputations.[2] Gains for a party are displayed with the cell's background shaded in that party's colour.
| Deputation | Previous control | New control | ||
|---|---|---|---|---|
| Álava | Basque Nationalist Party (EAJ/PNV) | Basque Nationalist Party (EAJ/PNV) | ||
| Biscay | Basque Nationalist Party (EAJ/PNV) | Basque Nationalist Party (EAJ/PNV) | ||
| Gipuzkoa | Basque Nationalist Party (EAJ/PNV) | Basque Nationalist Party (EAJ/PNV) (EA in 1986) | ||
Historical territories
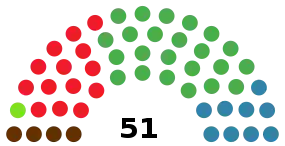
Álava
 | ||||||
| Parties and coalitions | Popular vote | Seats | ||||
|---|---|---|---|---|---|---|
| Votes | % | ±pp | Total | +/− | ||
| Basque Nationalist Party (EAJ/PNV) | 45,657 | 37.11 | +4.41 | 23 | –3 | |
| Socialist Party of the Basque Country (PSE–PSOE) | 34,890 | 28.36 | +12.52 | 14 | +7 | |
| People's Coalition (AP–PDP–UL)1 | 19,147 | 15.56 | +15.24 | 9 | +9 | |
| Popular Unity (HB) | 10,872 | 8.84 | New | 4 | +4 | |
| Basque Country Left (EE) | 7,571 | 6.15 | +2.82 | 1 | +1 | |
| Democratic and Social Centre (CDS) | 2,163 | 1.76 | New | 0 | ±0 | |
| Communist Party of the Basque Country (PCE/EPK) | 1,070 | 0.87 | –2.25 | 0 | ±0 | |
| Llodian Independent Group (AILL) | 741 | 0.60 | +0.04 | 0 | ±0 | |
| Union of the Democratic Centre (UCD) | n/a | n/a | –25.03 | 0 | –14 | |
| Independents (INDEP) | n/a | n/a | –16.63 | 0 | –10 | |
| Blank ballots | 920 | 0.75 | +0.31 | |||
| Total | 123,031 | 51 | –6 | |||
| Valid votes | 123,031 | 98.56 | –0.50 | |||
| Invalid votes | 1,793 | 1.44 | +0.50 | |||
| Votes cast / turnout | 124,824 | 66.80 | +1.45 | |||
| Abstentions | 62,046 | 33.20 | –1.45 | |||
| Registered voters | 186,870 | |||||
| Sources[1][2] | ||||||
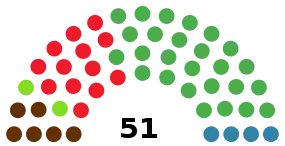
Biscay
 | ||||||
| Parties and coalitions | Popular vote | Seats | ||||
|---|---|---|---|---|---|---|
| Votes | % | ±pp | Total | +/− | ||
| Basque Nationalist Party (EAJ/PNV) | 223,572 | 39.58 | +0.16 | 26 | –14 | |
| Socialist Party of the Basque Country (PSE–PSOE) | 156,963 | 27.78 | +12.45 | 13 | –1 | |
| Popular Unity (HB) | 71,582 | 12.67 | –7.12 | 6 | –13 | |
| People's Coalition (AP–PDP–UL)1 | 55,962 | 9.91 | +9.91 | 4 | +4 | |
| Basque Country Left (EE) | 39,229 | 6.94 | +1.46 | 2 | –2 | |
| Communist Party of the Basque Country (PCE/EPK) | 14,181 | 2.51 | –3.00 | 0 | –3 | |
| Communist League–Internationalist Socialist Workers' Coalition (LC (COSI)) | 724 | 0.13 | New | 0 | ±0 | |
| Union of the Democratic Centre (UCD) | n/a | n/a | –11.13 | 0 | –10 | |
| Blank ballots | 2,711 | 0.48 | –0.01 | |||
| Total | 564,924 | 51 | –39 | |||
| Valid votes | 564,924 | 98.81 | +0.30 | |||
| Invalid votes | 6,785 | 1.19 | –0.30 | |||
| Votes cast / turnout | 571,709 | 65.56 | +4.26 | |||
| Abstentions | 300,279 | 34.44 | –4.26 | |||
| Registered voters | 871,988 | |||||
| Sources[1][2] | ||||||
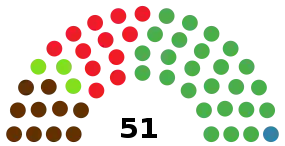
Gipuzkoa
 | ||||||
| Parties and coalitions | Popular vote | Seats | ||||
|---|---|---|---|---|---|---|
| Votes | % | ±pp | Total | +/− | ||
| Basque Nationalist Party (EAJ/PNV) | 126,656 | 40.49 | +5.46 | 25 | –8 | |
| Socialist Party of the Basque Country (PSE–PSOE) | 71,583 | 22.89 | +7.74 | 12 | ±0 | |
| Popular Unity (HB) | 60,027 | 19.19 | –2.21 | 10 | –9 | |
| Basque Country Left (EE) | 32,358 | 10.35 | –1.04 | 3 | –7 | |
| People's Coalition (AP–PDP–UL)1 | 12,977 | 4.15 | +4.11 | 1 | +1 | |
| Communist Party of the Basque Country (PCE/EPK) | 5,139 | 1.64 | –1.55 | 0 | ±0 | |
| Democratic and Social Centre (CDS) | 1,012 | 0.32 | New | 0 | ±0 | |
| Revolutionary Communist League (LKI/LCR) | 645 | 0.21 | –0.61 | 0 | ±0 | |
| Union of the Democratic Centre (UCD) | n/a | n/a | –8.42 | 0 | –7 | |
| Blank ballots | 2,373 | 0.76 | +0.33 | |||
| Total | 312,770 | 51 | –30 | |||
| Valid votes | 312,770 | 98.74 | –0.11 | |||
| Invalid votes | 3,999 | 1.26 | +0.11 | |||
| Votes cast / turnout | 316,769 | 62.12 | +0.46 | |||
| Abstentions | 193,180 | 37.88 | –0.46 | |||
| Registered voters | 509,949 | |||||
| Sources[1][2] | ||||||
References
- "Election Results Archive". euskadi.eus (in Spanish). Basque Government. Retrieved 23 February 2020.
- "Elecciones a las Juntas Generales (1979 - 2015)". Historia Electoral.com (in Spanish). Retrieved 23 February 2020.
| Regional elections | |
|---|---|
| General elections | |
| European Parliament elections | |
| Foral elections | |
| Local elections | |
| Referendums | |
This article is issued from Wikipedia. The text is licensed under Creative Commons - Attribution - Sharealike. Additional terms may apply for the media files.