2007 Wear Valley District Council election
The 2007 Wear Valley District Council election[2] took place on 3 May 2007 to elect members of Wear Valley District Council in England. This took place on the same day as other local elections across the UK.
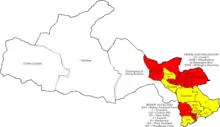
Map of the Wear Valley 2007 District Council election results[1]
All of the seats being contested were last contested in 2003.[3]
| Party | Candidate | Votes | % | ±% | |
|---|---|---|---|---|---|
| Liberal Democrats | Samuel Zair | 374 | 52.2 | ||
| Liberal Democrats | Sharon Ord | 248 | |||
| Labour | Bill Wade | 181 | 25.2 | ||
| Labour | Frederick Anderson | 176 | |||
| Conservative | Colin Firby | 162 | 22.6 | ||
| Conservative | Hazel Lodge | 160 | |||
| Turnout | 29.1 | ||||
| Liberal Democrats gain from Labour | Swing | ||||
| Liberal Democrats gain from Independent | Swing | ||||
| Party | Candidate | Votes | % | ±% | |
|---|---|---|---|---|---|
| Liberal Democrats | Neil Harrison | 600 | 36.7 | ||
| Liberal Democrats | Alan Anderson | 597 | |||
| Labour | Barbara Laurie | 559 | 34.1 | ||
| Conservative | Colin Raine | 478 | 29.2 | ||
| Conservative | Jim Tague | 458 | |||
| Liberal Democrats | Graham Snaith | 451 | |||
| Conservative | John Gasston | 437 | |||
| Labour | Keith Stokeld | 431 | |||
| Turnout | 39.7 | ||||
| Liberal Democrats hold | Swing | ||||
| Liberal Democrats hold | Swing | ||||
| Labour hold | Swing | ||||
| Party | Candidate | Votes | % | ±% | |
|---|---|---|---|---|---|
| Liberal Democrats | Tommy Taylor | 516 | 51 | ||
| Liberal Democrats | Diane Hardaker | 506 | |||
| Labour | Neil Stonehouse | 495 | 49 | ||
| Labour | Lucy Thompson | 465 | |||
| Labour | Norman Strongman | 370 | |||
| Turnout | 31.1 | ||||
| Liberal Democrats hold | Swing | ||||
| Liberal Democrats gain from Labour | Swing | ||||
| Labour hold | Swing | ||||
| Party | Candidate | Votes | % | ±% | |
|---|---|---|---|---|---|
| Liberal Democrats | Patricia Jopling | 222 | 54.7 | ||
| Labour | Graeme McKellar | 184 | 45.3 | ||
| Turnout | 30 | ||||
| Liberal Democrats gain from Labour | Swing | ||||
| Party | Candidate | Votes | % | ±% | |
|---|---|---|---|---|---|
| Labour | Eddie Murphy | 625 | 43.9 | ||
| Labour | Geoff Mowbray | 622 | |||
| Liberal Democrats | Ann Carrick | 580 | 40.7 | ||
| Labour | Peter Sung | 541 | |||
| Liberal Democrats | David English | 504 | |||
| Liberal Democrats | Gavin Jopling | 449 | |||
| BNP | Robert Muir | 219 | 15.3 | ||
| Turnout | 33.2 | ||||
| Labour hold | Swing | ||||
| Labour hold | Swing | ||||
| Liberal Democrats gain from Labour | Swing | ||||
| Party | Candidate | Votes | % | ±% | |
|---|---|---|---|---|---|
| Liberal Democrats | Dorothy Burn | 361 | 59.3 | ||
| Liberal Democrats | Gary Henry | 346 | |||
| Labour | Margaret Ingledew | 248 | 40.7 | ||
| Labour | Sandra Lethbridge | 222 | |||
| Turnout | 28.6 | ||||
| Liberal Democrats hold | Swing | ||||
| Liberal Democrats hold | Swing | ||||
| Party | Candidate | Votes | % | ±% | |
|---|---|---|---|---|---|
| Labour | Robert Yorke | 35.1 | |||
| Liberal Democrats | Vince Perkins | 290 | 34.1 | ||
| Liberal Democrats | John Fenwick | 280 | |||
| Conservative | Peter Laws | 262 | 30.8 | ||
| Labour | Olwyn Gunn | 260 | |||
| Conservative | Alisha Lynas | 250 | |||
| Turnout | 36.1 | ||||
| Labour gain from Liberal Democrats | Swing | ||||
| Liberal Democrats hold | Swing | ||||
| Party | Candidate | Votes | % | ±% | |
|---|---|---|---|---|---|
| Liberal Democrats | Betty Todd | 443 | 53.8 | ||
| Labour | John Lethbridge | 381 | 46.2 | ||
| Liberal Democrats | John Huntington | 371 | |||
| Labour | Reg Davison | 368 | |||
| Turnout | 29.9 | ||||
| Liberal Democrats hold | Swing | ||||
| Labour hold | Swing | ||||
| Party | Candidate | Votes | % | ±% | |
|---|---|---|---|---|---|
| Liberal Democrats | John Bailey | 336 | 74.7 | ||
| Labour | Steven Cason | 114 | 25.3 | ||
| Turnout | 32.8 | ||||
| Liberal Democrats gain from Labour | Swing | ||||
| Party | Candidate | Votes | % | ±% | |
|---|---|---|---|---|---|
| Liberal Democrats | Kenneth Bowser | 270 | 53.9 | ||
| Labour | David Nevins | 231 | 46.1 | ||
| Turnout | 35.1 | ||||
| Liberal Democrats gain from Labour | Swing | ||||
| Party | Candidate | Votes | % | ±% | |
|---|---|---|---|---|---|
| Independent | John Shuttleworth | 640 | 88.6 | ||
| Conservative | Christopher Houghton | 82 | 11.4 | ||
| Turnout | 59.6 | ||||
| Independent hold | Swing | ||||
| Party | Candidate | Votes | % | ±% | |
|---|---|---|---|---|---|
| Independent | Thomas Mews | 579 | 36.1 | ||
| Independent | Angela Bolam | 510 | |||
| Labour | William Hobson | 421 | 26.3 | ||
| Conservative | Christopher Rowell | 359 | 22.4 | ||
| Liberal Democrats | Anthony Simpson | 244 | 15.2 | ||
| Turnout | 43.1 | ||||
| Independent hold | Swing | ||||
| Independent gain from Labour | Swing | ||||
| Party | Candidate | Votes | % | ±% | |
|---|---|---|---|---|---|
| Labour | Colin Hayton | 418 | 34.2 | ||
| Labour | Jeff Gale | 407 | |||
| Independent | Ron Grogan | 399 | 32.6 | ||
| Labour | Jack Walker | 334 | |||
| Liberal Democrats | David Halliday | 246 | 20.1 | ||
| Conservative | Harvey Morgan | 161 | 13.2 | ||
| Turnout | 29.4 | ||||
| Labour hold | Swing | ||||
| Labour hold | Swing | ||||
| Independent hold | Swing | ||||
| Party | Candidate | Votes | % | ±% | |
|---|---|---|---|---|---|
| Liberal Democrats | Colin Mairs | 556 | 50.2 | ||
| Labour | Margaret Douthwaite | 552 | 49.8 | ||
| Liberal Democrats | John Ferguson | 539 | |||
| Liberal Democrats | Pauline Fenwick | 455 | |||
| Labour | Christine Wilson | 432 | |||
| Labour | Andrew Turner | 372 | |||
| Turnout | 31.2 | ||||
| Liberal Democrats gain from Labour | Swing | ||||
| Labour hold | Swing | ||||
| Liberal Democrats hold | Swing | ||||
| Party | Candidate | Votes | % | ±% | |
|---|---|---|---|---|---|
| Labour | Roger Ward | 384 | 55.6 | ||
| Labour | Rose Seabury | 337 | |||
| Liberal Democrats | Eileen Gooch | 307 | 44.4 | ||
| Liberal Democrats | James Gooch | 296 | |||
| Turnout | 31.2 | ||||
| Labour hold | Swing | ||||
| Labour hold | Swing | ||||
| Party | Candidate | Votes | % | ±% | |
|---|---|---|---|---|---|
| Labour | David Kingston | 676 | 55.5 | ||
| Labour | Alan Sinclair | 663 | |||
| Labour | Joe Buckham | 642 | |||
| Liberal Democrats | John Ferguson | 543 | 44.5 | ||
| Turnout | 29.3 | ||||
| Labour hold | Swing | ||||
| Labour hold | Swing | ||||
| Labour hold | Swing | ||||
| Party | Candidate | Votes | % | ±% | |
|---|---|---|---|---|---|
| Labour | Margaret Pinkney | 256 | 48.8 | ||
| Conservative | Becky Brunskill | 172 | 32.8 | ||
| Liberal Democrats | Anne Glynn | 97 | 18.5 | ||
| Turnout | 42.3 | ||||
| Liberal Democrats gain from Labour | Swing | ||||
| Party | Candidate | Votes | % | ±% | |
|---|---|---|---|---|---|
| Independent | Vere Shuttleworth | 618 | 68.1 | ||
| Independent | Desmond Wilson | 500 | |||
| Conservative | Christopher Rowell | 289 | 31.9 | ||
| Conservative | Christopher Rowell | 274 | |||
| Turnout | 36.4 | ||||
| Independent hold | Swing | ||||
| Independent hold | Swing | ||||
| Party | Candidate | Votes | % | ±% | |
|---|---|---|---|---|---|
| Labour | David Wilson | 404 | 58 | ||
| Labour | June Lee | 375 | |||
| Labour | Charlie Kay | 368 | |||
| Liberal Democrats | Lesley Zair | 292 | 42 | ||
| Liberal Democrats | Pauline Ferguson | 278 | |||
| Turnout | 21.9 | ||||
| Labour hold | Swing | ||||
| Labour hold | Swing | ||||
| Labour hold | Swing | ||||
- "Local Elections Archive Project - 2007 - Wear Valley". www.andrewteale.me.uk. Retrieved 29 March 2020.
- "Local Elections Archive Project - 2007 - Wear Valley". www.andrewteale.me.uk. Retrieved 29 March 2020.
- "Wear Valley District Council election results" (PDF).
This article is issued from Wikipedia. The text is licensed under Creative Commons - Attribution - Sharealike. Additional terms may apply for the media files.