2010 Kingston upon Thames London Borough Council election
Elections for the London Borough of Kingston upon Thames were held on 6 May 2010. The Liberal Democrats retained control of the council with an increased majority of six.[1]
Summary of results
| Party | Seats | Gains | Losses | Net gain/loss | Seats % | Votes % | Votes | +/− | |
|---|---|---|---|---|---|---|---|---|---|
| Liberal Democrats | 27 | 5 | 3 | +2 | 56% | 43% | |||
| Conservative | 21 | 3 | 3 | 0 | 44% | 40% | |||
| Labour | 0 | 0 | 2 | -2 | 12% | ||||
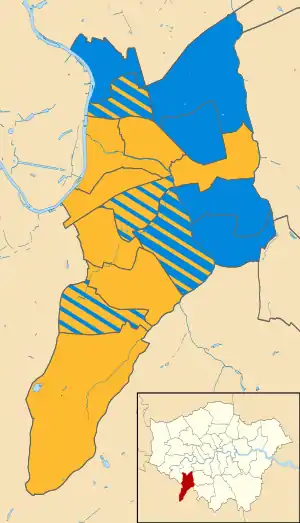
Results by ward
Alexandra
| Party | Candidate | Votes | % | ±% | |
|---|---|---|---|---|---|
| Liberal Democrats | John Burgess | 2,169 | 44.6 | -0.6 | |
| Conservative | Michael Burden | 2,046 | 42.0 | -1.9 | |
| Conservative | Richard Hudson* | 2,022 | 41.5 | -3.9 | |
| Conservative | Ian George* | 2,003 | 41.1 | -3.1 | |
| Liberal Democrats | Terence Hazzard | 1,909 | 39.2 | -3.8 | |
| Liberal Democrats | Kalpen Patel | 1,683 | 34.6 | -7.2 | |
| Labour | Marian Freedman | 576 | 11.8 | +5.3 | |
| Labour | Lawrence Green | 522 | 10.7 | +4.3 | |
| Labour | Anna Ring | 439 | 9.0 | +3.6 | |
| Green | Phil Smith | 334 | 6.9 | N/A | |
| CPA | Samantha Jacobs | 107 | 2.2 | N/A | |
| CPA | Barbara Zhang | 74 | 1.5 | N/A | |
| Liberal Democrats hold | Swing | ||||
| Conservative hold | Swing | ||||
| Conservative hold | Swing | ||||
Berrylands
| Party | Candidate | Votes | % | ±% | |
|---|---|---|---|---|---|
| Liberal Democrats | Frances Moseley* | 2,333 | 46.5 | -0.6 | |
| Liberal Democrats | Bob Steed* | 2,080 | 41.5 | -2.6 | |
| Conservative | Karen George | 1,939 | 38.6 | -3.6 | |
| Liberal Democrats | Rohan Yoganathan* | 1,933 | 38.5 | -3.9 | |
| Conservative | David Hutchinson | 1,894 | 37.8 | -3.0 | |
| Conservative | Peter Topp | 1,884 | 37.6 | -2.9 | |
| Labour | John Lee | 508 | 10.1 | +4.9 | |
| Green | Martin Lake | 507 | 10.1 | +0.1 | |
| Labour | Charlotte Ward | 477 | 9.5 | +3.6 | |
| Labour | Alasdair Reisner | 396 | 7.9 | +3.3 | |
| CPA | Anna Lofts | 92 | 1.8 | -1.1 | |
| CPA | Paul Jacobs | 89 | 1.8 | N/A | |
| CPA | Jonathan Rudd | 84 | 1.7 | N/A | |
| Liberal Democrats hold | Swing | ||||
| Liberal Democrats hold | Swing | ||||
| Conservative gain from Liberal Democrats | Swing | ||||
Beverley
| Party | Candidate | Votes | % | ±% | |
|---|---|---|---|---|---|
| Liberal Democrats | Derek Osbourne* | 2,138 | 44.1 | -2.2 | |
| Liberal Democrats | Trevor Heap | 2,081 | 42.9 | -3.9 | |
| Liberal Democrats | Simon James* | 2,044 | 42.1 | -4.4 | |
| Conservative | Caroline Bowis | 1,738 | 35.8 | +4.5 | |
| Conservative | Darren Spraggs | 1,591 | 32.8 | +3.6 | |
| Conservative | Mike Head | 1,530 | 31.5 | -1.0 | |
| Labour | Duncan Braithwaite | 657 | 13.5 | +4.0 | |
| Green | Chris Walker | 581 | 12.0 | -1.9 | |
| Labour | Roger Price | 566 | 11.7 | +2.5 | |
| Labour | Dyan Sellayah | 474 | 9.8 | +0.8 | |
| CPA | Valerie Hancock | 158 | 3.3 | -0.9 | |
| CPA | David Campanale | 139 | 2.9 | -0.2 | |
| CPA | Mark Riley | 139 | 2.9 | +0.2 | |
| Liberal Democrats hold | Swing | ||||
| Liberal Democrats hold | Swing | ||||
| Liberal Democrats hold | Swing | ||||
Canbury
| Party | Candidate | Votes | % | ±% | |
|---|---|---|---|---|---|
| Liberal Democrats | Timothy Dennen | 2,469 | 42.3 | +2.4 | |
| Conservative | Andrea Craig | 2,333 | 39.9 | +1.1 | |
| Conservative | Geoffrey Austin* | 2,283 | 39.1 | -1.3 | |
| Conservative | Hamish Pritchard | 2,131 | 36.5 | -1.4 | |
| Liberal Democrats | Maha Alfakier | 1,927 | 33.0 | -4.1 | |
| Liberal Democrats | Bart Ricketts | 1,801 | 30.8 | -4.6 | |
| Green | Johanna Hunt | 899 | 15.4 | -1.4 | |
| Labour | Katie Hill | 711 | 12.2 | -0.3 | |
| Labour | Colin Startup | 678 | 11.6 | +0.5 | |
| Labour | Chris Priest | 630 | 10.8 | +0.1 | |
| Liberal Democrats hold | Swing | ||||
| Conservative hold | Swing | ||||
| Conservative hold | Swing | ||||
Chessington North & Hook
| Party | Candidate | Votes | % | ±% | |
|---|---|---|---|---|---|
| Liberal Democrats | Alan Dean | 1,990 | 45.1 | -0.2 | |
| Liberal Democrats | Margaret Thompson | 1,921 | 43.5 | -1.3 | |
| Conservative | Andrew Day | 1,754 | 39.7 | -4.3 | |
| Liberal Democrats | Ivor Knight | 1,662 | 37.6 | -7.1 | |
| Conservative | Jamal Chohan | 1,457 | 33.0 | -5.9 | |
| Conservative | Maundy Todd | 1,454 | 32.9 | -4.9 | |
| Labour | Steve Kearney | 490 | 11.1 | +3.3 | |
| Labour | Dick Bradford | 453 | 10.3 | +1.8 | |
| Labour | Tony Cottrell | 419 | 9.5 | +2.0 | |
| Green | Christine Sherlock | 233 | 5.3 | N/A | |
| CPA | Anthony May | 139 | 3.1 | N/A | |
| CPA | Wendy Pickard | 104 | 2.4 | N/A | |
| CPA | Doreen Scrimshaw | 63 | 1.4 | N/A | |
| Liberal Democrats hold | Swing | ||||
| Liberal Democrats hold | Swing | ||||
| Conservative gain from Liberal Democrats | Swing | ||||
Chessington South
| Party | Candidate | Votes | % | ±% | |
|---|---|---|---|---|---|
| Liberal Democrats | Patricia Bamford* | 2,455 | 48.5 | -2.0 | |
| Liberal Democrats | Shiraz Mirza* | 2,202 | 43.5 | -4.7 | |
| Liberal Democrats | Rachel Reid | 2,148 | 42.4 | -4.0 | |
| Conservative | Maureen Rowley | 1,794 | 35.4 | -0.9 | |
| Conservative | Michelle Akintoye | 1,738 | 34.3 | -1.3 | |
| Conservative | Colin Suckling | 1,722 | 34.0 | +2.3 | |
| Labour | Bill Davies | 621 | 12.3 | +1.3 | |
| Labour | John Dodwell | 439 | 8.7 | -1.7 | |
| Labour | Vilma Watt | 389 | 7.7 | -1.9 | |
| Independent | John Hayball | 207 | 4.1 | +0.3 | |
| CPA | Susan May | 149 | 2.9 | -0.2 | |
| CPA | Martin Pickard | 128 | 2.5 | -1.3 | |
| CPA | Maria Pereira | 113 | 2.2 | N/A | |
| Liberal Democrats hold | Swing | ||||
| Liberal Democrats hold | Swing | ||||
| Liberal Democrats hold | Swing | ||||
Coombe Hill
| Party | Candidate | Votes | % | ±% | |
|---|---|---|---|---|---|
| Conservative | Patrick Codd* | 2,455 | 54.0 | -15.0 | |
| Conservative | David Edwards* | 2,354 | 51.8 | -14.7 | |
| Conservative | Eric Humphrey* | 2,304 | 50.7 | -13.2 | |
| Liberal Democrats | David Knowles | 1,314 | 28.9 | +11.6 | |
| Liberal Democrats | Eleanor Tatler | 1,194 | 26.3 | +12.6 | |
| Liberal Democrats | Jonathan Oates | 1,019 | 22.4 | +6.2 | |
| Labour | Judith Cowley | 521 | 11.5 | +2.3 | |
| Labour | Sally Richardson | 495 | 10.9 | +2.3 | |
| Labour | Ian Parker | 458 | 10.1 | +2.9 | |
| Green | Jean Vidler | 391 | 8.6 | -1.4 | |
| CPA | Philippa Hayward | 82 | 1.8 | -1.5 | |
| CPA | Alex Priest | 77 | 1.7 | N/A | |
| CPA | Funkazi Koroye-Crooks | 68 | 1.5 | N/A | |
| Conservative hold | Swing | ||||
| Conservative hold | Swing | ||||
| Conservative hold | Swing | ||||
Coombe Vale
| Party | Candidate | Votes | % | ±% | |
|---|---|---|---|---|---|
| Conservative | Adrian Holder* | 2,306 | 46.3 | -5.1 | |
| Conservative | Robert-John Tasker* | 2,084 | 41.9 | -7.2 | |
| Conservative | James White* | 2,074 | 41.7 | -8.8 | |
| Liberal Democrats | Julie Haines | 1,995 | 40.1 | +7.6 | |
| Liberal Democrats | Kamal Kugan | 1,784 | 35.9 | +6.7 | |
| Liberal Democrats | Mary Watts | 1,743 | 35.0 | +8.7 | |
| Labour | Anthony Murray | 531 | 10.7 | +2.0 | |
| Labour | Jak Codd | 508 | 10.2 | +2.6 | |
| Labour | Michael Morton | 469 | 9.4 | +1.9 | |
| Green | Nighat Taimuri | 391 | 7.9 | -1.3 | |
| CPA | Jennifer Riley | 145 | 2.9 | -4.1 | |
| CPA | Rajesh Dewan | 129 | 2.6 | -2.2 | |
| CPA | Esther Priest | 111 | 2.2 | -1.2 | |
| Conservative hold | Swing | ||||
| Conservative hold | Swing | ||||
| Conservative hold | Swing | ||||
Grove
| Party | Candidate | Votes | % | ±% | |
|---|---|---|---|---|---|
| Liberal Democrats | Chrissie Hitchcock* | 2,527 | 51.6 | +3.8 | |
| Liberal Democrats | Barry O'Mahony** | 2,391 | 48.8 | +6.1 | |
| Liberal Democrats | Marc Woodall | 2,037 | 41.6 | +1.3 | |
| Conservative | Adrian Amer | 1,505 | 30.7 | -2.1 | |
| Conservative | Terry Bowers | 1,475 | 30.1 | -5.4 | |
| Conservative | James Pirret | 1,390 | 28.4 | -3.1 | |
| Green | Ryan Bridgewater | 713 | 14.6 | -3.6 | |
| Labour | Bill Bennett | 618 | 12.6 | +3.3 | |
| Labour | Laurence South | 584 | 11.9 | +3.7 | |
| Labour | Amand Stuart | 576 | 11.8 | +3.5 | |
| Independent | Denise Norman | 272 | 5.6 | N/A | |
| Liberal Democrats hold | Swing | ||||
| Liberal Democrats hold | Swing | ||||
| Liberal Democrats hold | Swing | ||||
Barry O'Mahony was a sitting councillor, but for St Mark's ward.
Norbiton
| Party | Candidate | Votes | % | ±% | |
|---|---|---|---|---|---|
| Liberal Democrats | Penny Shelton* | 1,799 | 43.0 | +5.9 | |
| Liberal Democrats | Stephen Brister | 1,748 | 41.8 | +9.5 | |
| Liberal Democrats | David Ryder-Mills** | 1,698 | 40.6 | +9.0 | |
| Labour | Stephen Mama* | 1,170 | 28.0 | -11.0 | |
| Conservative | Leslie Blake | 978 | 23.4 | +4.8 | |
| Labour | Susanna Bellino | 950 | 22.7 | -15.2 | |
| Labour | Stella Simpson | 860 | 20.6 | -16.1 | |
| Conservative | Romana Chohan | 774 | 18.5 | +2.0 | |
| Conservative | Liu Yang | 715 | 17.1 | +1.0 | |
| Independent | Sheila Griffin* | 628 | 15.0 | -22.9 | |
| Green | Martin Hall | 437 | 10.5 | -2.2 | |
| Liberal Democrats hold | Swing | ||||
| Liberal Democrats hold | Swing | ||||
| Liberal Democrats hold | Swing | ||||
David Ryder-Mills was a sitting councillor, but for Canbury ward.
Sheila Griffin had been elected in 2006 as a Labour councillor.
Old Malden
| Party | Candidate | Votes | % | ±% | |
|---|---|---|---|---|---|
| Conservative | David Fraser* | 2,363 | 46.5 | -0.5 | |
| Conservative | Mick Amson* | 2,262 | 44.5 | -0.3 | |
| Conservative | Kate Stinton | 2,016 | 39.6 | -4.7 | |
| Liberal Democrats | Ghazala Hayat | 1,914 | 37.6 | -4.6 | |
| Liberal Democrats | Kerry Williams | 1,899 | 37.3 | -7.2 | |
| Liberal Democrats | Suk-Ha Kwon | 1,689 | 33.2 | -5.3 | |
| Labour | Ian Kellett | 501 | 9.9 | +2.6 | |
| Labour | John Knowles | 471 | 9.3 | +3.5 | |
| Labour | George Pearson | 441 | 8.7 | +2.0 | |
| Green | Adeela Taimuri | 261 | 5.1 | N/A | |
| Independent | Daniel Goodger | 258 | 5.1 | N/A | |
| CPA | Roger Glencross | 139 | 2.7 | -1.4 | |
| Conservative hold | Swing | ||||
| Conservative hold | Swing | ||||
| Conservative gain from Liberal Democrats | Swing | ||||
St James
| Party | Candidate | Votes | % | ±% | |
|---|---|---|---|---|---|
| Conservative | Howard Jones* | 2,008 | 44.7 | -11.4 | |
| Conservative | Ken Smith* | 1,948 | 43.3 | -12.0 | |
| Conservative | Priyen Patel | 1,679 | 37.4 | -21.7 | |
| Liberal Democrats | Celia Osbourne | 1,549 | 34.5 | +7.5 | |
| Liberal Democrats | David Bamford | 1,502 | 33.4 | +7.8 | |
| Liberal Democrats | Chris Sullivan | 1,280 | 28.5 | +3.9 | |
| Labour | Gerry Jones | 885 | 19.7 | +9.2 | |
| Labour | Eric Master | 516 | 11.5 | +0.4 | |
| Labour | Mary Masters | 513 | 11.4 | +2.4 | |
| Green | Mike Perry | 342 | 7.6 | N/A | |
| UKIP | Michael Watson | 259 | 5.8 | N/A | |
| CPA | Eleanor Glencross | 184 | 4.1 | +0.5 | |
| Conservative hold | Swing | ||||
| Conservative hold | Swing | ||||
| Conservative hold | Swing | ||||
St Mark's
| Party | Candidate | Votes | % | ±% | |
|---|---|---|---|---|---|
| Liberal Democrats | Liz Green* | 2,612 | 51.1 | -2.3 | |
| Liberal Democrats | Mary Heathcote | 2,439 | 47.7 | -4.0 | |
| Liberal Democrats | Yogan Yoganathan* | 2,169 | 42.4 | -8.8 | |
| Conservative | Paul Beal | 1,846 | 36.1 | +3.7 | |
| Conservative | Geoffrey Doyle | 1,814 | 35.5 | +3.7 | |
| Conservative | Deborah Patient | 1,745 | 34.1 | +3.0 | |
| Green | Satin Dattani | 584 | 11.4 | -2.9 | |
| Labour | Sandra Coombs | 536 | 10.5 | +4.2 | |
| Labour | James Lancaster | 400 | 9.7 | +3.7 | |
| Labour | Niranjan Jayasundera | 371 | 7.3 | +3.0 | |
| CPA | Keith Reynolds | 100 | 2.0 | -0.1 | |
| Liberal Democrats hold | Swing | ||||
| Liberal Democrats hold | Swing | ||||
| Liberal Democrats hold | Swing | ||||
Surbiton Hill
| Party | Candidate | Votes | % | ±% | |
|---|---|---|---|---|---|
| Liberal Democrats | Neil Houston | 2,411 | 44.3 | +12.9 | |
| Liberal Democrats | Malcolm Self | 2,297 | 42.2 | +12.8 | |
| Liberal Democrats | Umesh Parekh | 2,183 | 40.1 | +14.3 | |
| Conservative | Nick Kilby* | 2,080 | 38.2 | -13.4 | |
| Conservative | Mavis Cracknell | 2,034 | 37.4 | -13.9 | |
| Conservative | Paul Johnston* | 1,948 | 35.8 | -13.6 | |
| Labour | David Cooper | 640 | 11.8 | +2.5 | |
| Labour | Geoffrey Parnell | 501 | 9.2 | +1.2 | |
| Labour | Anne Vase | 467 | 8.6 | +0.7 | |
| Green | Brian Mulley | 452 | 8.3 | -6.2 | |
| CPA | Simon Groves | 120 | 2.2 | -1.0 | |
| CPA | Julian Orton | 110 | 2.0 | N/A | |
| CPA | Silvina Bonansea-Ryan | 93 | 1.7 | N/A | |
| Liberal Democrats gain from Conservative | Swing | ||||
| Liberal Democrats gain from Conservative | Swing | ||||
| Liberal Democrats gain from Conservative | Swing | ||||
Tolworth & Hook Rise
| Party | Candidate | Votes | % | ±% | |
|---|---|---|---|---|---|
| Liberal Democrats | Vicki Harris* | 2,559 | 53.5 | -5.7 | |
| Liberal Democrats | Rolson Davies* | 2,510 | 52.5 | -10.6 | |
| Liberal Democrats | Sharon Hartley | 2,087 | 43.7 | -13.5 | |
| Conservative | Judith Jones | 1,399 | 29.3 | +4.1 | |
| Conservative | Lucky Kumpeson | 1,300 | 27.2 | +2.2 | |
| Conservative | Rob Pattenden | 1,220 | 25.5 | +1.8 | |
| Labour | Mike Blakeney | 622 | 13.0 | +5.1 | |
| Labour | Brian Harris | 528 | 11.0 | +3.2 | |
| Labour | Marilyn Corry | 495 | 10.4 | +3.3 | |
| Green | Christopher Murphy | 322 | 6.7 | N/A | |
| Independent | Vic Bellamy | 300 | 6.3 | N/A | |
| CPA | Kenneth Scrimshaw | 118 | 2.5 | -1.2 | |
| CPA | Sharon Young | 80 | 1.7 | N/A | |
| CPA | Joy Waugh | 51 | 1.1 | N/A | |
| Liberal Democrats hold | Swing | ||||
| Liberal Democrats hold | Swing | ||||
| Liberal Democrats hold | Swing | ||||
Tudor
| Party | Candidate | Votes | % | ±% | |
|---|---|---|---|---|---|
| Conservative | David Cunningham* | 2,731 | 52.2 | -5.8 | |
| Conservative | Dennis Doe* | 2,482 | 47.5 | -6.0 | |
| Conservative | Frank Thompson* | 2,328 | 44.5 | -7.6 | |
| Liberal Democrats | Marilyn Mason | 1,976 | 37.8 | +10.9 | |
| Liberal Democrats | Rupert Nichol | 1,661 | 31.8 | +7.8 | |
| Liberal Democrats | Majeed Neky | 1,563 | 29.9 | +7.7 | |
| Green | Tariq Shabbeer | 573 | 11.0 | -7.7 | |
| Labour | Brian Morris | 538 | 10.3 | +2.0 | |
| Labour | James Smy | 529 | 10.1 | +0.1 | |
| Labour | Gabriel Abulafia | 426 | 8.1 | +2.0 | |
| Conservative hold | Swing | ||||
| Conservative hold | Swing | ||||
| Conservative hold | Swing | ||||
By-elections: 2010–2014
A by-election was held in Surbiton Hill ward following the resignation of Umesh Parekh.
| Party | Candidate | Votes | % | ±% | |
|---|---|---|---|---|---|
| Liberal Democrats | John Ayles | 997 | 39.7 | -2.6 | |
| Conservative | Nick Kilby | 895 | 35.6 | -0.9 | |
| Labour | Katie Hill | 349 | 13.9 | +2.7 | |
| CPA | Benjamin Roberts | 171 | 6.8 | +4.7 | |
| Green | Chris Walker | 81 | 3.2 | -4.7 | |
| Independent | James Riding | 21 | 0.8 | N/A | |
| Majority | 102 | 4.1 | |||
| Liberal Democrats hold | Swing | ||||
A by-election was held for two seats in Coombe Vale ward following the death of James White and resignation of Robert-John Tasker.
| Party | Candidate | Votes | % | ±% | |
|---|---|---|---|---|---|
| Conservative | Lynne Finnerty | 1,340 | 45.3 | +2.3 | |
| Conservative | Julie Pickering | 1,308 | 44.2 | +1.2 | |
| Liberal Democrats | Kamal Kugan | 908 | 30.7 | -6.5 | |
| Liberal Democrats | Rupert Nichol | 778 | 26.3 | -10.9 | |
| Labour | Nick Brown | 526 | 17.8 | +7.9 | |
| Labour | Ian Parker | 502 | 17.0 | +7.1 | |
| Green | Chris Walker | 122 | 4.1 | -3.2 | |
| Green | Tariq Shabbeer | 108 | 3.7 | -3.6 | |
| CPA | Philippa Hayward | 94 | 3.2 | +0.5 | |
| CPA | Roger Glencross | 76 | 2.6 | -0.1 | |
| UKIP | Michael Watson | 70 | 2.4 | N/A | |
| Majority | 400 | 13.5 | |||
| Conservative hold | Swing | ||||
| Conservative hold | Swing | ||||
A by-election was held in Coombe Hill ward following the resignation of David Edwards.
| Party | Candidate | Votes | % | ±% | |
|---|---|---|---|---|---|
| Conservative | Gajan Wallooppillai | 1,601 | 53.8 | +2.3 | |
| Labour | Laurie South | 519 | 17.4 | +6.5 | |
| Liberal Democrats | David Knowles | 409 | 13.7 | -13.9 | |
| Green | Jean Vidler | 235 | 7.9 | -0.3 | |
| UKIP | Michael Watson | 148 | 5.0 | N/A | |
| CPA | Rajesh Dewan | 66 | 2.2 | +0.5 | |
| Majority | 1,082 | 36.4 | |||
| Conservative hold | Swing | ||||
A by-election was held in Grove ward following the resignation of Marc Woodall.
| Party | Candidate | Votes | % | ±% | |
|---|---|---|---|---|---|
| Liberal Democrats | Rebekah Moll | 710 | 32.6 | -12.2 | |
| Conservative | Adrian Amer | 687 | 31.5 | +4.8 | |
| Labour | Laurie South | 440 | 20.2 | +9.2 | |
| UKIP | Michael Watson | 175 | 8.0 | N/A | |
| Green | Ryan Coley | 123 | 5.6 | -7.1 | |
| BNP | David Child | 23 | 1.1 | N/A | |
| CPA | Jonathan Rudd | 20 | 0.9 | N/A | |
| Majority | 23 | 1.1 | |||
| Liberal Democrats hold | Swing | ||||
A by-election was held in Berrylands ward following the death of Frances Moseley.
| Party | Candidate | Votes | % | ±% | |
|---|---|---|---|---|---|
| Liberal Democrats | Sushila Abraham | 948 | 38.7 | -4.7 | |
| Conservative | Mike Head | 761 | 31.0 | -5.0 | |
| Labour | Tony Banks | 455 | 18.6 | +9.2 | |
| UKIP | Michael Watson | 175 | 7.1 | N/A | |
| Green | Ryan Coley | 112 | 4.6 | -4.8 | |
| Majority | 187 | 7.7 | |||
| Liberal Democrats hold | Swing | ||||
A by-election was held in Beverley ward following the resignation of Derek Osborne. Osborne had been leader of Kingston Council, and was arrested on child sex offence charges.
| Party | Candidate | Votes | % | ±% | |
|---|---|---|---|---|---|
| Conservative | Terence Paton | 1,033 | 35.1 | +2.1 | |
| Liberal Democrats | Lesley Heap | 760 | 25.9 | -14.7 | |
| Labour | Marian Freedman | 717 | 24.4 | +11.9 | |
| UKIP | Michael Watson | 223 | 7.6 | N/A | |
| Green | Chris Walker | 207 | 7.0 | -4.0 | |
| Majority | 273 | 9.2 | |||
| Conservative gain from Liberal Democrats | Swing | ||||
References
- "Kingston Council Election Results 2010". Kingston 2010. 7 May 2010. Retrieved 10 May 2010.
- "Kingston-upon-Thames". London Councils. 7 May 2010. Archived from the original on 10 May 2010. Retrieved 9 May 2010.
| Mayor of London | |
|---|---|
| London Assembly | |
| Inner London Education Authority | |
| Greater London Council | |
| London County Council | |
| Borough Councils | |
| Referendums | |
| |