Agalawatta Polling Division
The Agalawatta Polling Division is a Polling Division in the Kalutara Electoral District, in the Western Province, Sri Lanka.
Agalawatta | |
|---|---|
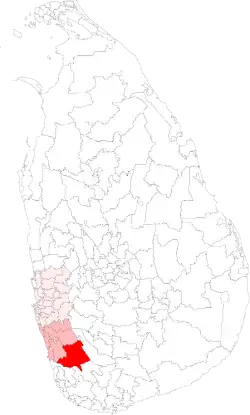 | |
| Coordinates: 6.471177°N 80.209978°E | |
| Country | Sri Lanka |
| Province | Western Province, Sri Lanka |
| Electoral District | Kalutara Electoral District |
| Area | |
| • Total | 612.57 km2 (236.51 sq mi) |
| Population (2012)[1] | |
| • Total | 142,098 |
| • Density | 232/km2 (600/sq mi) |
| ISO 3166 code | EC-03H |
Presidential Election Results
Summary
The winner of Agalawatta has matched the final country result 6 out of 8 times. Hence, Agalawatta is a Weak Bellwether for Presidential Elections.
| Year | Agalawatta | Kalutara Electoral District | MAE[2] % | Sri Lanka | MAE[3] % | |||
|---|---|---|---|---|---|---|---|---|
| 2019 | SLPP | SLPP | 1.61% | SLPP | 8.27% | |||
| 2015 | UPFA | UPFA | 3.62% | NDF | 8.50% | |||
| 2010 | UPFA | UPFA | 2.35% | UPFA | 7.25% | |||
| 2005 | UPFA | UPFA | 1.81% | UPFA | 3.35% | |||
| 1999 | PA | PA | 2.89% | PA | 1.22% | |||
| 1994 | PA | PA | 2.61% | PA | 3.53% | |||
| 1988 | SLFP | SLFP | 1.23% | UNP | 2.80% | |||
| 1982 | UNP | UNP | 1.40% | UNP | 2.33% | |||
| Matches/Mean MAE | 6/8 | 6/8 | 2.19% | 8/8 | 4.66% | |||
2019 Sri Lankan Presidential Election
| Party | Agalawatta[4] | Kalutara Electoral District | Sri Lanka | |||||||
|---|---|---|---|---|---|---|---|---|---|---|
| Votes | % | Votes | % | Votes | % | |||||
| SLPP | 52,400 | 61.36% | 482,920 | 59.49% | 6,924,255 | 52.25% | ||||
| NDF | 28,744 | 33.66% | 284,213 | 35.01% | 5,564,239 | 41.99% | ||||
| NMPP | 2,319 | 2.72% | 27,681 | 3.41% | 418,553 | 3.16% | ||||
| Other Parties (with < 1%) | 1,928 | 2.26% | 16,949 | 2.09% | 345,452 | 2.61% | ||||
| Valid Votes | 85,391 | 99.43% | 811,763 | 99.16% | 13,252,499 | 98.99% | ||||
| Rejected Votes | 492 | 0.57% | 6,847 | 0.84% | 135,452 | 1.01% | ||||
| Total Polled | 85,883 | 86.33% | 818,610 | 85.71% | 13,387,951 | 83.71% | ||||
| Registered Electors | 99,484 | 955,080 | 15,992,568 | |||||||
2015 Sri Lankan Presidential Election
| Party | Agalawatta[5] | Kalutara Electoral District | Sri Lanka | |||||||
|---|---|---|---|---|---|---|---|---|---|---|
| Votes | % | Votes | % | Votes | % | |||||
| UPFA | 44,750 | 56.17% | 395,890 | 52.65% | 5,768,090 | 47.58% | ||||
| NDF | 33,995 | 42.67% | 349,404 | 46.46% | 6,217,162 | 51.28% | ||||
| Other Parties (with < 1%) | 929 | 1.17% | 6,690 | 0.89% | 138,200 | 1.14% | ||||
| Valid Votes | 79,674 | 98.76% | 751,984 | 98.90% | 12,123,452 | 98.85% | ||||
| Rejected Votes | 1,002 | 1.24% | 8,381 | 1.10% | 140,925 | 1.15% | ||||
| Total Polled | 80,676 | 80.64% | 760,365 | 82.08% | 12,264,377 | 78.69% | ||||
| Registered Electors | 100,040 | 926,346 | 15,585,942 | |||||||
2010 Sri Lankan Presidential Election
| Party | Agalawatta[6] | Kalutara Electoral District | Sri Lanka | |||||||
|---|---|---|---|---|---|---|---|---|---|---|
| Votes | % | Votes | % | Votes | % | |||||
| UPFA | 47,317 | 65.24% | 412,562 | 63.06% | 6,015,934 | 57.88% | ||||
| NDF | 23,717 | 32.70% | 231,807 | 35.43% | 4,173,185 | 40.15% | ||||
| Other Parties (with < 1%) | 1,489 | 2.05% | 9,880 | 1.51% | 204,494 | 1.97% | ||||
| Valid Votes | 72,523 | 99.33% | 654,249 | 99.31% | 10,393,613 | 99.03% | ||||
| Rejected Votes | 486 | 0.67% | 4,541 | 0.69% | 101,838 | 0.97% | ||||
| Total Polled | 73,009 | 77.69% | 658,790 | 79.05% | 10,495,451 | 66.70% | ||||
| Registered Electors | 93,972 | 833,360 | 15,734,587 | |||||||
2005 Sri Lankan Presidential Election
| Party | Agalawatta[7] | Kalutara Electoral District | Sri Lanka | |||||||
|---|---|---|---|---|---|---|---|---|---|---|
| Votes | % | Votes | % | Votes | % | |||||
| UPFA | 37,518 | 53.54% | 341,693 | 55.48% | 4,887,152 | 50.29% | ||||
| UNP | 31,449 | 44.88% | 266,043 | 43.20% | 4,706,366 | 48.43% | ||||
| Other Parties (with < 1%) | 1,114 | 1.59% | 8,124 | 1.32% | 123,521 | 1.27% | ||||
| Valid Votes | 70,081 | 99.07% | 615,860 | 98.95% | 9,717,039 | 98.88% | ||||
| Rejected Votes | 656 | 0.93% | 6,517 | 1.05% | 109,869 | 1.12% | ||||
| Total Polled | 70,737 | 78.62% | 622,377 | 79.67% | 9,826,908 | 69.51% | ||||
| Registered Electors | 89,979 | 781,175 | 14,136,979 | |||||||
1999 Sri Lankan Presidential Election
| Party | Agalawatta[8] | Kalutara Electoral District | Sri Lanka | |||||||
|---|---|---|---|---|---|---|---|---|---|---|
| Votes | % | Votes | % | Votes | % | |||||
| PA | 30,128 | 49.54% | 281,217 | 52.88% | 4,312,157 | 51.12% | ||||
| UNP | 26,506 | 43.59% | 217,423 | 40.88% | 3,602,748 | 42.71% | ||||
| JVP | 3,014 | 4.96% | 23,770 | 4.47% | 343,927 | 4.08% | ||||
| Other Parties (with < 1%) | 1,165 | 1.92% | 9,399 | 1.77% | 176,679 | 2.09% | ||||
| Valid Votes | 60,813 | 98.02% | 531,809 | 97.83% | 8,435,754 | 97.69% | ||||
| Rejected Votes | 1,226 | 1.98% | 11,796 | 2.17% | 199,536 | 2.31% | ||||
| Total Polled | 62,039 | 75.52% | 543,605 | 78.23% | 8,635,290 | 72.17% | ||||
| Registered Electors | 82,145 | 694,860 | 11,965,536 | |||||||
1994 Sri Lankan Presidential Election
| Party | Agalawatta[9] | Kalutara Electoral District | Sri Lanka | |||||||
|---|---|---|---|---|---|---|---|---|---|---|
| Votes | % | Votes | % | Votes | % | |||||
| PA | 32,467 | 58.77% | 295,686 | 61.47% | 4,709,205 | 62.28% | ||||
| UNP | 21,903 | 39.65% | 178,466 | 37.10% | 2,715,283 | 35.91% | ||||
| Other Parties (with < 1%) | 876 | 1.59% | 6,867 | 1.43% | 137,040 | 1.81% | ||||
| Valid Votes | 55,246 | 98.41% | 481,019 | 98.50% | 7,561,526 | 98.03% | ||||
| Rejected Votes | 893 | 1.59% | 7,309 | 1.50% | 151,706 | 1.97% | ||||
| Total Polled | 56,139 | 71.48% | 488,328 | 73.97% | 7,713,232 | 69.12% | ||||
| Registered Electors | 78,540 | 660,191 | 11,158,880 | |||||||
1988 Sri Lankan Presidential Election
| Party | Agalawatta[10] | Kalutara Electoral District | Sri Lanka | |||||||
|---|---|---|---|---|---|---|---|---|---|---|
| Votes | % | Votes | % | Votes | % | |||||
| SLFP | 15,255 | 48.71% | 179,761 | 49.57% | 2,289,857 | 44.95% | ||||
| UNP | 15,155 | 48.40% | 169,510 | 46.74% | 2,569,199 | 50.43% | ||||
| SLMP | 905 | 2.89% | 13,375 | 3.69% | 235,701 | 4.63% | ||||
| Valid Votes | 31,315 | 98.36% | 362,646 | 98.23% | 5,094,754 | 98.24% | ||||
| Rejected Votes | 521 | 1.64% | 6,537 | 1.77% | 91,499 | 1.76% | ||||
| Total Polled | 31,836 | 44.85% | 369,183 | 64.20% | 5,186,256 | 55.87% | ||||
| Registered Electors | 70,991 | 575,008 | 9,283,143 | |||||||
1982 Sri Lankan Presidential Election
| Party | Agalawatta[11] | Kalutara Electoral District | Sri Lanka | |||||||
|---|---|---|---|---|---|---|---|---|---|---|
| Votes | % | Votes | % | Votes | % | |||||
| UNP | 25,681 | 50.35% | 211,592 | 50.15% | 3,450,815 | 52.93% | ||||
| SLFP | 21,041 | 41.25% | 185,874 | 44.06% | 2,546,348 | 39.05% | ||||
| LSSP | 2,079 | 4.08% | 8,613 | 2.04% | 58,531 | 0.90% | ||||
| JVP | 2,043 | 4.01% | 14,499 | 3.44% | 273,428 | 4.19% | ||||
| Other Parties (with < 1%) | 159 | 0.31% | 1,314 | 0.31% | 190,929 | 2.93% | ||||
| Valid Votes | 51,003 | 98.18% | 421,892 | 98.76% | 6,520,156 | 98.78% | ||||
| Rejected Votes | 944 | 1.82% | 5,290 | 1.24% | 80,470 | 1.22% | ||||
| Total Polled | 51,947 | 82.60% | 427,182 | 83.97% | 6,600,626 | 80.15% | ||||
| Registered Electors | 62,890 | 508,744 | 8,235,358 | |||||||
Parliamentary Election Results
Summary
The winner of Agalawatta has matched the final country result 6 out of 7 times. Hence, Agalawatta is a Strong Bellwether for Parliamentary Elections.
| Year | Agalawatta | Kalutara Electoral District | MAE[12] % | Sri Lanka | MAE[13] % | |||
|---|---|---|---|---|---|---|---|---|
| 2015 | UPFA | UPFA | 2.28% | UNP | 5.23% | |||
| 2010 | UPFA | UPFA | 3.36% | UPFA | 5.35% | |||
| 2004 | UPFA | UPFA | 3.14% | UPFA | 5.31% | |||
| 2001 | UNP | UNP | 1.05% | UNP | 2.01% | |||
| 2000 | PA | PA | 2.41% | PA | 2.06% | |||
| 1994 | PA | PA | 1.57% | PA | 2.41% | |||
| 1989 | UNP | UNP | 4.14% | UNP | 5.56% | |||
| Matches/Mean MAE | 6/7 | 6/7 | 2.56% | 7/7 | 3.99% | |||
2015 Sri Lankan Parliamentary Election
| Party | Agalawatta[14] | Kalutara Electoral District | Sri Lanka | |||||||
|---|---|---|---|---|---|---|---|---|---|---|
| Votes | % | Votes | % | Votes | % | |||||
| UPFA | 38,125 | 51.88% | 338,801 | 48.58% | 4,732,664 | 42.48% | ||||
| UNP | 31,731 | 43.18% | 310,234 | 44.48% | 5,098,916 | 45.77% | ||||
| JVP | 2,860 | 3.89% | 38,475 | 5.52% | 544,154 | 4.88% | ||||
| Other Parties (with < 1%) | 776 | 1.06% | 9,951 | 1.43% | 85,579 | 0.77% | ||||
| Valid Votes | 73,492 | 96.42% | 697,461 | 97.00% | 11,140,333 | 95.35% | ||||
| Rejected Votes | 2,691 | 3.53% | 21,366 | 2.97% | 516,926 | 4.42% | ||||
| Total Polled | 76,219 | 76.19% | 719,001 | 80.13% | 11,684,111 | 77.66% | ||||
| Registered Electors | 100,040 | 897,349 | 15,044,490 | |||||||
2010 Sri Lankan Parliamentary Election
| Party | Agalawatta[15] | Kalutara Electoral District | Sri Lanka | |||||||
|---|---|---|---|---|---|---|---|---|---|---|
| Votes | % | Votes | % | Votes | % | |||||
| UPFA | 35,541 | 68.25% | 313,836 | 63.74% | 4,846,388 | 60.38% | ||||
| UNP | 14,402 | 27.66% | 139,596 | 28.35% | 2,357,057 | 29.37% | ||||
| DNA | 1,909 | 3.67% | 36,722 | 7.46% | 441,251 | 5.50% | ||||
| Other Parties (with < 1%) | 223 | 0.43% | 2,246 | 0.46% | 34,923 | 0.44% | ||||
| Valid Votes | 52,075 | 88.27% | 492,400 | 90.41% | 8,026,322 | 96.03% | ||||
| Rejected Votes | 6,851 | 11.61% | 51,751 | 9.50% | 581,465 | 6.96% | ||||
| Total Polled | 58,994 | 62.78% | 544,606 | 65.21% | 8,358,246 | 59.29% | ||||
| Registered Electors | 93,972 | 835,186 | 14,097,690 | |||||||
2004 Sri Lankan Parliamentary Election
| Party | Agalawatta[16] | Kalutara Electoral District | Sri Lanka | |||||||
|---|---|---|---|---|---|---|---|---|---|---|
| Votes | % | Votes | % | Votes | % | |||||
| UPFA | 33,939 | 53.66% | 291,208 | 51.72% | 4,223,126 | 45.70% | ||||
| UNP | 26,456 | 41.83% | 212,721 | 37.78% | 3,486,792 | 37.73% | ||||
| JHU | 2,538 | 4.01% | 56,615 | 10.06% | 552,723 | 5.98% | ||||
| Other Parties (with < 1%) | 313 | 0.49% | 2,475 | 0.44% | 49,030 | 0.53% | ||||
| Valid Votes | 63,246 | 93.13% | 563,019 | 94.82% | 9,241,931 | 94.52% | ||||
| Rejected Votes | 4,665 | 6.87% | 30,741 | 5.18% | 534,452 | 5.47% | ||||
| Total Polled | 67,911 | 77.05% | 593,760 | 79.58% | 9,777,821 | 75.74% | ||||
| Registered Electors | 88,142 | 746,138 | 12,909,631 | |||||||
2001 Sri Lankan Parliamentary Election
| Party | Agalawatta[17] | Kalutara Electoral District | Sri Lanka | |||||||
|---|---|---|---|---|---|---|---|---|---|---|
| Votes | % | Votes | % | Votes | % | |||||
| UNP | 29,734 | 47.39% | 254,339 | 45.94% | 4,086,026 | 45.62% | ||||
| PA | 25,147 | 40.08% | 226,468 | 40.91% | 3,330,815 | 37.19% | ||||
| JVP | 6,599 | 10.52% | 60,451 | 10.92% | 815,353 | 9.10% | ||||
| Other Parties (with < 1%) | 1,266 | 2.02% | 12,361 | 2.23% | 137,091 | 1.53% | ||||
| Valid Votes | 62,746 | 92.67% | 553,619 | 94.44% | 8,955,844 | 94.77% | ||||
| Rejected Votes | 4,963 | 7.33% | 32,617 | 5.56% | 494,009 | 5.23% | ||||
| Total Polled | 67,709 | 78.64% | 586,236 | 81.68% | 9,449,878 | 76.03% | ||||
| Registered Electors | 86,105 | 717,764 | 12,428,762 | |||||||
2000 Sri Lankan Parliamentary Election
| Party | Agalawatta[18] | Kalutara Electoral District | Sri Lanka | |||||||
|---|---|---|---|---|---|---|---|---|---|---|
| Votes | % | Votes | % | Votes | % | |||||
| PA | 28,531 | 45.85% | 255,175 | 46.86% | 3,899,329 | 45.33% | ||||
| UNP | 27,665 | 44.45% | 217,215 | 39.89% | 3,451,765 | 40.12% | ||||
| JVP | 4,128 | 6.63% | 38,373 | 7.05% | 518,725 | 6.03% | ||||
| Other Parties (with < 1%) | 1,073 | 1.72% | 18,136 | 3.33% | 321,730 | 3.74% | ||||
| SU | 835 | 1.34% | 15,619 | 2.87% | 127,859 | 1.49% | ||||
| Valid Votes | 62,232 | N/A | 544,518 | N/A | 8,602,617 | N/A | ||||
1994 Sri Lankan Parliamentary Election
| Party | Agalawatta[19] | Kalutara Electoral District | Sri Lanka | |||||||
|---|---|---|---|---|---|---|---|---|---|---|
| Votes | % | Votes | % | Votes | % | |||||
| PA | 31,009 | 52.41% | 271,754 | 53.77% | 3,887,805 | 48.94% | ||||
| UNP | 27,007 | 45.65% | 221,115 | 43.75% | 3,498,370 | 44.04% | ||||
| SLPF | 693 | 1.17% | 6,238 | 1.23% | 90,078 | 1.13% | ||||
| Other Parties (with < 1%) | 456 | 0.77% | 6,253 | 1.24% | 69,351 | 0.87% | ||||
| Valid Votes | 59,165 | 93.94% | 505,360 | 95.21% | 7,943,688 | 95.20% | ||||
| Rejected Votes | 3,818 | 6.06% | 25,397 | 4.79% | 400,395 | 4.80% | ||||
| Total Polled | 62,983 | 80.19% | 530,757 | 80.20% | 8,344,095 | 74.75% | ||||
| Registered Electors | 78,540 | 661,793 | 11,163,064 | |||||||
1989 Sri Lankan Parliamentary Election
| Party | Agalawatta[20] | Kalutara Electoral District | Sri Lanka | |||||||
|---|---|---|---|---|---|---|---|---|---|---|
| Votes | % | Votes | % | Votes | % | |||||
| UNP | 16,311 | 56.59% | 160,069 | 49.84% | 2,838,005 | 50.71% | ||||
| SLFP | 11,397 | 39.54% | 131,510 | 40.94% | 1,785,369 | 31.90% | ||||
| USA | 679 | 2.36% | 12,342 | 3.84% | 141,983 | 2.54% | ||||
| Other Parties (with < 1%) | 434 | 1.51% | 17,272 | 5.38% | 360,219 | 6.44% | ||||
| Valid Votes | 28,821 | 91.89% | 321,193 | 94.10% | 5,596,468 | 93.87% | ||||
| Rejected Votes | 2,545 | 8.11% | 20,139 | 5.90% | 365,563 | 6.13% | ||||
| Total Polled | 31,366 | 44.85% | 341,332 | 59.86% | 5,962,031 | 63.60% | ||||
| Registered Electors | 69,937 | 570,193 | 9,374,164 | |||||||
Demographics
Ethnicity
The Agalawatta Polling Division has a Sinhalese majority (94.7%) . In comparison, the Kalutara Electoral District (which contains the Agalawatta Polling Division) has a Sinhalese majority (86.8%) [1]
Ethnicity in Agalawatta[1]
Other (0.5%)
References
- "Census of Population and Housing 2012". statistics.gov.lk. Department of Census and Statistics, Sri Lanka. 2012.
- The mean absolute error, between the percentages of votes each party got in Agalawatta and the Kalutara Electoral District. It is a measure of the difference in voting behaviour between the two regions.
- The mean absolute error, between the percentages of votes each party got in Agalawatta and the country. It is a measure of the difference in voting behaviour between the two regions.
- "2019 Sri Lankan presidential election Results". elections.gov.lk. Election Commission of Sri Lanka. 2019.
- "2015 Sri Lankan presidential election Results". elections.gov.lk. Election Commission of Sri Lanka. 2015.
- "2010 Sri Lankan presidential election Results". elections.gov.lk. Election Commission of Sri Lanka. 2010.
- "2005 Sri Lankan presidential election Results". elections.gov.lk. Election Commission of Sri Lanka. 2005.
- "1999 Sri Lankan presidential election Results". elections.gov.lk. Election Commission of Sri Lanka. 1999.
- "1994 Sri Lankan presidential election Results". elections.gov.lk. Election Commission of Sri Lanka. 1994.
- "1988 Sri Lankan presidential election Results". elections.gov.lk. Election Commission of Sri Lanka. 1988.
- "1982 Sri Lankan presidential election Results". elections.gov.lk. Election Commission of Sri Lanka. 1982.
- The mean absolute error, between the percentages of votes each party got in Agalawatta and the Kalutara Electoral District. It is a measure of the difference in voting behaviour between the two regions.
- The mean absolute error, between the percentages of votes each party got in Agalawatta and the country. It is a measure of the difference in voting behaviour between the two regions.
- "2015 Sri Lankan parliamentary election Results" (PDF). elections.gov.lk. Election Commission of Sri Lanka. 2015.
- "2010 Sri Lankan parliamentary election Results" (PDF). elections.gov.lk. Election Commission of Sri Lanka. 2010.
- "2004 Sri Lankan parliamentary election Results" (PDF). elections.gov.lk. Election Commission of Sri Lanka. 2004.
- "2001 Sri Lankan parliamentary election Results" (PDF). elections.gov.lk. Election Commission of Sri Lanka. 2001.
- "2000 Sri Lankan parliamentary election Results" (PDF). elections.gov.lk. Election Commission of Sri Lanka. 2000.
- "1994 Sri Lankan parliamentary election Results" (PDF). elections.gov.lk. Election Commission of Sri Lanka. 1994.
- "1989 Sri Lankan parliamentary election Results" (PDF). elections.gov.lk. Election Commission of Sri Lanka. 1989.
This article is issued from Wikipedia. The text is licensed under Creative Commons - Attribution - Sharealike. Additional terms may apply for the media files.