Bad Kissingen (electoral district)
Bad Kissingen is an electoral constituency (German: Wahlkreis) represented in the Bundestag. It elects one member via first-past-the-post voting. Under the current constituency numbering system, it is designated as constituency 248. It is located in northwestern Bavaria, comprising the districts of Bad Kissingen, Haßberge, and Rhön-Grabfeld.[1]
| 248 Bad Kissingen | |
|---|---|
| electoral district for the Bundestag | |
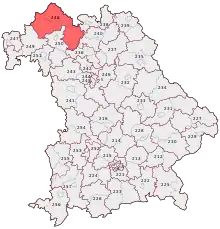 Bad Kissingen in 2017 | |
| State | Bavaria |
| Population | 267,400 (2015) |
| Electorate | 216,030 (2017) |
| Major settlements | Bad Kissingen Bad Neustadt an der Saale Haßfurt |
| Area | 3,115.1 km2 |
| Current electoral district | |
| Created | 1949 |
| Party | CSU |
| Member | Dorothee Bär |
| Elected | 2009, 2013, 2017 |
Bad Kissingen was created for the inaugural 1949 federal election. Since 2009, it has been represented by Dorothee Bär of the Christian Social Union (CSU).[2]
Geography
Bad Kissingen is located in northwestern Bavaria. As of the 2021 federal election, it comprises the districts of Bad Kissingen, Haßberge, and Rhön-Grabfeld.[1]
History
Bad Kissingen was created in 1949. In the 1949 election, it was Bavaria constituency 37 in the numbering system. In the 1953 through 1961 elections, it was number 232. In the 1965 through 1998 elections, it was number 234. In the 2002 and 2005 elections, it was number 249. Since the 2009 election, it has been number 248.
Originally, the constituency comprised the independent city of Bad Kissingen and the districts of Landkreis Bad Kissingen, Ebern, Haßfurt, Hofheim, Königshofen, and Mellrichstadt. In the 1965 through 1972 elections, it also contained the district of Bad Neustadt an der Saale. It acquired its current borders in the 1976 election.
| Election | No. | Name | Borders |
|---|---|---|---|
| 1949 | 37 | Bad Kissingen |
|
| 1953 | 232 | ||
| 1957 | |||
| 1961 | |||
| 1965 | 234 |
| |
| 1969 | |||
| 1972 | |||
| 1976 |
| ||
| 1980 | |||
| 1983 | |||
| 1987 | |||
| 1990 | |||
| 1994 | |||
| 1998 | |||
| 2002 | 249 | ||
| 2005 | |||
| 2009 | 248 | ||
| 2013 | |||
| 2017 | |||
| 2021 |
Members
The constituency has been held continuously by the Christian Social Union (CSU) since its creation. It was first represented by Gustav Fuchs from 1949 to 1961, followed by Alex Hösl from 1961 to 1980. Eduard Lintner was representative from 1980 to 2009, a total of eight consecutive terms. Dorothee Bär was elected in 2009, and re-elected in 2013 and 2017.
| Election | Member | Party | % | |
|---|---|---|---|---|
| 1949 | Gustav Fuchs | CSU | 42.4 | |
| 1953 | 57.9 | |||
| 1957 | 66.7 | |||
| 1961 | Alex Hösl | CSU | 64.7 | |
| 1965 | 69.0 | |||
| 1969 | 68.2 | |||
| 1972 | 67.1 | |||
| 1976 | 70.0 | |||
| 1980 | Eduard Lintner | CSU | 69.1 | |
| 1983 | 72.5 | |||
| 1987 | 68.4 | |||
| 1990 | 65.2 | |||
| 1994 | 61.6 | |||
| 1998 | 56.5 | |||
| 2002 | 63.4 | |||
| 2005 | 57.5 | |||
| 2009 | Dorothee Bär | CSU | 53.7 | |
| 2013 | 57.9 | |||
| 2017 | 51.1 | |||
Election results
2017 election
| Federal election (2017): Bad Kissingen[3] | |||||||||
|---|---|---|---|---|---|---|---|---|---|
| Notes: |
Blue background denotes the winner of the electorate vote.
| ||||||||
| Party | Candidate | Votes | % | ±% | Party votes | % | ±% | ||
| CSU | 86,603 | 51.1 | 75,788 | 44.6 | |||||
| SPD | Sabine Dittmar | 32,383 | 19.1 | 26,904 | 15.8 | ||||
| AfD | Andrea Klingen | 17,753 | 10.5 | 19,650 | 11.6 | ||||
| Green | Manuela Rottmann | 11,980 | 7.1 | 11,359 | 6.7 | ||||
| FDP | Nicolas Thoma | 9,534 | 5.6 | 15,084 | 8.9 | ||||
| Left | Frank Hertel | 9,071 | 5.4 | 10,085 | 5.9 | ||||
| FW | 4,075 | 2.4 | |||||||
| ÖDP | Michaela Reinhard | 2,083 | 1.2 | 1,089 | 0.6 | ||||
| PARTEI | 1,078 | 0.6 | |||||||
| NPD | 926 | 0.5 | |||||||
| Pirates | 610 | 0.4 | |||||||
| BP | 494 | 0.3 | |||||||
| DM | 313 | 0.2 | |||||||
| Gesundheitsforschung | 283 | 0.2 | |||||||
| V-Partei³ | 273 | 0.2 | |||||||
| BGE | 195 | 0.1 | |||||||
| DiB | 188 | 0.1 | |||||||
| MLPD | 38 | 0.0 | |||||||
| BüSo | 26 | 0.0 | |||||||
| DKP | 16 | 0.0 | |||||||
| Informal votes | 1,795 | 1,300 | |||||||
| Total Valid votes | 169,407 | 169,902 | |||||||
| Turnout | 171,202 | 79.2 | |||||||
| CSU hold | Majority | 54,220 | 32.0 | ||||||
2013 election
| Federal election (2013): Bad Kissingen[4] | |||||||||
|---|---|---|---|---|---|---|---|---|---|
| Notes: |
Blue background denotes the winner of the electorate vote.
| ||||||||
| Party | Candidate | Votes | % | ±% | Party votes | % | ±% | ||
| CSU | 88,911 | 57.9 | 82,760 | 53.9 | |||||
| SPD | Sabine Dittmar | 30,564 | 19.9 | 27,931 | 18.2 | ||||
| Green | Hans-Josef Fell | 12,127 | 7.9 | 9,874 | 6.4 | ||||
| Left | Stefan Bannert | 6,930 | 4.5 | 6,946 | 4.5 | ||||
| FDP | Erhard Stubenrauch | 4,391 | 2.9 | 7,342 | 4.8 | ||||
| AfD | 4,988 | 3.2 | |||||||
| FW | Christine Wehe | 4,259 | 2.8 | 4,129 | 2.7 | ||||
| Pirates | Benjamin Wildenauer | 3,562 | 2.3 | 2,980 | 1.9 | ||||
| NPD | Horst Fuchs | 2,789 | 1.8 | 2,018 | 1.3 | ||||
| ÖDP | 1,119 | 0.7 | |||||||
| Tierschutzpartei | 919 | 0.6 | |||||||
| REP | 884 | 0.6 | |||||||
| BP | 756 | 0.5 | |||||||
| DIE FRAUEN | 311 | 0.2 | |||||||
| Party of Reason | 239 | 0.2 | |||||||
| DIE VIOLETTEN | 167 | 0.1 | |||||||
| PRO | 125 | 0.1 | |||||||
| RRP | 67 | 0.0 | |||||||
| MLPD | 40 | 0.0 | |||||||
| BüSo | 27 | 0.0 | |||||||
| Informal votes | 1,822 | 1,733 | |||||||
| Total Valid votes | 153,533 | 153,622 | |||||||
| Turnout | 155,355 | 71.3 | |||||||
| CSU hold | Majority | 58,347 | 38.0 | ||||||
2009 election
| Federal election (2009): Bad Kissingen[5] | |||||||||
|---|---|---|---|---|---|---|---|---|---|
| Notes: |
Blue background denotes the winner of the electorate vote.
| ||||||||
| Party | Candidate | Votes | % | ±% | Party votes | % | ±% | ||
| CSU | Dorothee Bär | 85,574 | 53.7 | 75,708 | 47.3 | ||||
| SPD | Susanne Kastner | 28,487 | 17.9 | 23,712 | 14.8 | ||||
| Green | Hans-Josef Fell | 14,723 | 9.2 | 12,475 | 7.8 | ||||
| FDP | Adelheid Zimmermann | 13,592 | 8.5 | 22,188 | 13.9 | ||||
| Left | Stefan Bannert | 13,000 | 8.2 | 13,717 | 8.6 | ||||
| Pirates | 2,807 | 1.8 | |||||||
| NPD | Johannes Hühnlein | 3,305 | 2.1 | 2,504 | 1.6 | ||||
| REP | 1,580 | 1.0 | |||||||
| FAMILIE | 1,339 | 0.8 | |||||||
| ÖDP | 1,242 | 0.8 | |||||||
| Tierschutzpartei | 804 | 0.5 | |||||||
| Independent | Helmut Schätzlein | 712 | 0.4 | ||||||
| RRP | 703 | 0.4 | |||||||
| BP | 495 | 0.3 | |||||||
| DIE VIOLETTEN | 264 | 0.2 | |||||||
| PBC | 259 | 0.2 | |||||||
| CM | 196 | 0.1 | |||||||
| DVU | 70 | 0.0 | |||||||
| BüSo | 56 | 0.0 | |||||||
| MLPD | 33 | 0.0 | |||||||
| Informal votes | 2,659 | 1,900 | |||||||
| Total Valid votes | 159,393 | 160,152 | |||||||
| Turnout | 162,052 | 73.8 | |||||||
| CSU hold | Majority | 57,087 | 35.8 | ||||||
References
- "Constituency Bad Kissingen". Federal Returning Officer.
- "Results for Bad Kissingen". Federal Returning Officer.
- Results for Bad Kissingen
- Results for Bad Kissingen
- Results for Bad Kissingen
| Current |
|
|---|---|
| Other states |
|
| See also | |