Weilheim (electoral district)
Weilheim is an electoral constituency (German: Wahlkreis) represented in the Bundestag. It elects one member via first-past-the-post voting. Under the current constituency numbering system, it is designated as constituency 226. It is located in southwestern Bavaria, comprising the districts of Garmisch-Partenkirchen and Weilheim-Schongau.[1]
| 226 Weilheim | |
|---|---|
| electoral district for the Bundestag | |
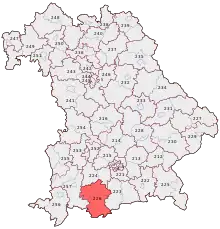 Weilheim in 2017 | |
| State | Bavaria |
| Population | 220,300 (2015) |
| Electorate | 167,159 (2017) |
| Major settlements | Weilheim in Oberbayern Penzberg Schongau |
| Area | 1,978.6 km2 |
| Current electoral district | |
| Created | 1949 |
| Party | CSU |
| Member | Alexander Dobrindt |
| Elected | 2002, 2005, 2009, 2013, 2017 |
Weilheim was created for the inaugural 1949 federal election. Since 2002, it has been represented by Alexander Dobrindt of the Christian Social Union (CSU).[2]
Geography
Weilheim is located in southern Bavaria. As of the 2021 federal election, it comprises the districts of Garmisch-Partenkirchen and Weilheim-Schongau.[1]
History
Weilheim was created in 1949. In the 1949 election, it was Bavaria constituency 12 in the numbering system. In the 1953 through 1961 elections, it was number 207. In the 1965 through 1998 elections, it was number 212. In the 2002 and 2005 elections, it was number 227. Since the 2009 election, it has been number 226.
Originally, the constituency comprised the districts of Bad Tölz, Garmisch-Partenkirchen, Schongau, and Weilheim. In the 1976 election, it comprised the districts of Bad Tölz-Wolfratshausen, Garmisch-Partenkirchen, and Weilheim-Schongau. In the 1980 through 2013 elections, it comrpised the districts of Garmisch-Partenkirchen, Landsberg, and Weilheim-Schongau. It acquired its current borders in the 2017 election.
| Election | No. | Name | Borders |
|---|---|---|---|
| 1949 | 12 | Weilheim |
|
| 1953 | 207 | ||
| 1957 | |||
| 1961 | |||
| 1965 | 212 | ||
| 1969 | |||
| 1972 | |||
| 1976 |
| ||
| 1980 |
| ||
| 1983 | |||
| 1987 | |||
| 1990 | |||
| 1994 | |||
| 1998 | |||
| 2002 | 227 | ||
| 2005 | |||
| 2009 | 226 | ||
| 2013 | |||
| 2017 |
| ||
| 2021 |
Members
The constituency has been held continuously by the Christian Social Union (CSU) since its creation. It was first represented by long-time CSU leader Franz Josef Strauss from 1949 to 1987, a total of ten consecutive terms; however, he resigned from the Bundestag in 1978 to become Minister-President of Bavaria, and subsequently turned down his Bundestag mandate after the 1980 and 1983 elections. He was succeeded by Michaela Geiger, who was representative from 1987 to 2002. Alexander Dobrindt was elected in 2002, and re-elected in 2005, 2009, 2013, and 2017.
| Election | Member | Party | % | |
|---|---|---|---|---|
| 1949 | Franz Josef Strauss | CSU | 28.8 | |
| 1953 | 52.3 | |||
| 1957 | 57.6 | |||
| 1961 | 57.7 | |||
| 1965 | 58.9 | |||
| 1969 | 62.0 | |||
| 1972 | 62.3 | |||
| 1976 | 66.3 | |||
| 1980 | 65.4 | |||
| 1983 | 68.8 | |||
| 1987 | Michaela Geiger | CSU | 67.1 | |
| 1990 | 61.8 | |||
| 1994 | 62.0 | |||
| 1998 | 58.0 | |||
| 2002 | Alexander Dobrindt | CSU | 63.5 | |
| 2005 | 59.4 | |||
| 2009 | 52.0 | |||
| 2013 | 57.2 | |||
| 2017 | 47.9 | |||
Election results
2017 election
| Federal election (2017): Weilheim[3] | |||||||||
|---|---|---|---|---|---|---|---|---|---|
| Notes: |
Blue background denotes the winner of the electorate vote.
| ||||||||
| Party | Candidate | Votes | % | ±% | Party votes | % | ±% | ||
| CSU | 63,784 | 47.9 | 57,254 | 42.9 | |||||
| SPD | Enrico Corongiu | 19,722 | 14.8 | 15,402 | 11.5 | ||||
| AfD | Edeltraud Schwarz | 13,383 | 10.1 | 16,145 | 12.1 | ||||
| Green | Gabriela Seitz-Hoffmann | 12,066 | 9.1 | 12,753 | 9.5 | ||||
| FDP | Karl-Martin Schröter | 9,370 | 7.0 | 13,909 | 10.4 | ||||
| Left | Reinhard Böttger | 6,229 | 4.7 | 7,214 | 5.4 | ||||
| FW | 2,876 | 2.2 | |||||||
| ÖDP | Maiken Winter | 4,629 | 3.5 | 2,145 | 1.6 | ||||
| BP | Siegfried Seelos | 3,855 | 2.9 | 2,225 | 1.7 | ||||
| Tierschutzpartei | 1,186 | 0.9 | |||||||
| PARTEI | 724 | 0.5 | |||||||
| Pirates | 352 | 0.3 | |||||||
| DM | 292 | 0.2 | |||||||
| V-Partei³ | 260 | 0.2 | |||||||
| NPD | 227 | 0.2 | |||||||
| DiB | 204 | 0.2 | |||||||
| BGE | 186 | 0.1 | |||||||
| Gesundheitsforschung | 162 | 0.1 | |||||||
| MLPD | 22 | 0.0 | |||||||
| DKP | 15 | 0.0 | |||||||
| BüSo | 14 | 0.0 | |||||||
| Informal votes | 1,295 | 766 | |||||||
| Total Valid votes | 133,038 | 133,567 | |||||||
| Turnout | 134,333 | 80.4 | |||||||
| CSU hold | Majority | 44,602 | 33.1 | ||||||
2013 election
| Federal election (2013): Weilheim[4] | |||||||||
|---|---|---|---|---|---|---|---|---|---|
| Notes: |
Blue background denotes the winner of the electorate vote.
| ||||||||
| Party | Candidate | Votes | % | ±% | Party votes | % | ±% | ||
| CSU | 104,236 | 57.2 | 95,885 | 52.5 | |||||
| SPD | Angelica Dullinger | 30,019 | 16.5 | 28,342 | 15.5 | ||||
| Green | Gabriela Seitz-Hoffmann | 15,559 | 8.5 | 16,017 | 8.8 | ||||
| AfD | 9,665 | 5.3 | |||||||
| FW | Susann Enders | 6,429 | 3.5 | 4,441 | 2.4 | ||||
| BP | Klaus Jacobitz | 5,599 | 3.1 | 3,573 | 2.0 | ||||
| FDP | Klaus Breil | 5,325 | 2.9 | 9,461 | 5.2 | ||||
| Left | Michaele Siebe | 5,321 | 2.9 | 5,629 | 3.1 | ||||
| ÖDP | Hanns-Dieter Schlierf | 5,010 | 2.7 | 3,011 | 1.6 | ||||
| Pirates | Alexander Lessmann | 3,137 | 1.7 | 2,907 | 1.6 | ||||
| Tierschutzpartei | 1,284 | 0.7 | |||||||
| NPD | Matthias Polt | 1,581 | 0.9 | 1,062 | 0.6 | ||||
| REP | 412 | 0.2 | |||||||
| DIE FRAUEN | 321 | 0.2 | |||||||
| DIE VIOLETTEN | 271 | 0.1 | |||||||
| Party of Reason | 196 | 0.1 | |||||||
| PRO | 137 | 0.1 | |||||||
| RRP | 79 | 0.0 | |||||||
| MLPD | 45 | 0.0 | |||||||
| BüSo | 32 | 0.0 | |||||||
| Informal votes | 1,951 | 1,397 | |||||||
| Total Valid votes | 182,216 | 182,770 | |||||||
| Turnout | 184,167 | 72.9 | |||||||
| CSU hold | Majority | 74,220 | 40.7 | ||||||
2009 election
| Federal election (2009): Weilheim[5] | |||||||||
|---|---|---|---|---|---|---|---|---|---|
| Notes: |
Blue background denotes the winner of the electorate vote.
| ||||||||
| Party | Candidate | Votes | % | ±% | Party votes | % | ±% | ||
| CSU | 94,302 | 52.0 | 83,058 | 45.6 | |||||
| SPD | Angelica Dullinger | 25,894 | 14.3 | 23,512 | 12.9 | ||||
| Green | Marcus Reichenberg | 21,516 | 11.9 | 20,871 | 11.5 | ||||
| FDP | Klaus Breil | 19,076 | 10.5 | 28,911 | 15.9 | ||||
| Left | Werner Bäumler | 7,568 | 4.2 | 8,897 | 4.9 | ||||
| ÖDP | Hanns-Dieter Schlierf | 4,511 | 2.5 | 3,277 | 1.8 | ||||
| Pirates | 3,098 | 1.7 | |||||||
| BP | Pauli Doll | 3,399 | 1.9 | 2,740 | 1.5 | ||||
| RRP | Klaus Blume | 1,921 | 1.1 | 1,966 | 1.1 | ||||
| NPD | Matthias Polt | 1,883 | 1.0 | 1,501 | 1.0 | ||||
| FAMILIE | 1,257 | 0.7 | |||||||
| Tierschutzpartei | 1,128 | 0.6 | |||||||
| REP | 835 | 0.5 | |||||||
| Independent | Monica Herz | 725 | 0.4 | ||||||
| Independent | Waltraud Siade | 598 | 0.3 | ||||||
| DIE VIOLETTEN | 489 | 0.3 | |||||||
| PBC | 219 | 0.1 | |||||||
| CM | 193 | 0.1 | |||||||
| DVU | 91 | 0.0 | |||||||
| BüSo | 57 | 0.0 | |||||||
| MLPD | 28 | 0.0 | |||||||
| Informal votes | 2,439 | 1,704 | |||||||
| Total Valid votes | 181,393 | 182,128 | |||||||
| Turnout | 183,832 | 73.8 | |||||||
| CSU hold | Majority | 68,408 | 37.7 | ||||||
References
- "Constituency Weilheim". Federal Returning Officer.
- "Results for Weilheim". Federal Returning Officer.
- Results for Weilheim
- Results for Weilheim
- Results for Weilheim
| Current |
|
|---|---|
| Other states |
|
| See also | |