Borken II
Borken II is an electoral constituency (German: Wahlkreis) represented in the Bundestag. It elects one member via first-past-the-post voting. Under the current constituency numbering system, it is designated as constituency 126. It is located in northern North Rhine-Westphalia, comprising the western and central part of the Borken district.[1]
| 126 Borken II | |
|---|---|
| electoral district for the Bundestag | |
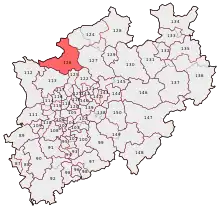 Borken II in 2013 | |
| State | North Rhine-Westphalia |
| Population | 260,300 (2015) |
| Electorate | 199,978 (2017) |
| Major settlements | Bocholt Borken Vreden |
| Area | 996.4 km2 |
| Current electoral district | |
| Created | 1949 |
| Party | CDU |
| Member | Johannes Röring |
| Elected | 2005, 2009, 2013, 2017 |
Borken II was created for the inaugural 1949 federal election. Since 2005, it has been represented by Johannes Röring of the Christian Democratic Union (CDU).[2]
Geography
Borken II is located in northern North Rhine-Westphalia. As of the 2021 federal election, it comprises the entirety of the Borken district excluding the municipalities of Ahaus, Gronau, Heek, Legden, and Schöppingen.[1]
History
Borken II was created in 1949, then known as Borken – Bocholt – Ahaus. From 1965 through 1976, it was named Ahaus – Bocholt. From 1980 through 1987, it was named Borken. It acquired its current name in the 1990 election. In the 1949 election, it was North Rhine-Westphalia constituency 35 in the numbering system. From 1953 through 1961, it was number 94. From 1965 through 1976, it was number 92. From 1980 through 1998, it was number 96. From 2002 through 2009, it was number 127. Since 2013, it has been number 126.
Originally, the constituency comprised the districts of Borken and Ahaus and the independent city of Bocholt. In the 1980 through 1987 elections, it was coterminous with the district of Borken. From 1990 through 1998, it comprised the municipalities of Ahaus, Bocholt, Borken, Gescher, Gronau, Heek, Isselburg, Legden, Rhede, Schöppingen, Stadtlohn, Südlohn, Velen, and Vreden from Borken district. It acquired its current borders in the 2002 election.
| Election | No. | Name | Borders |
|---|---|---|---|
| 1949 | 35 | Borken – Bocholt – Ahaus | |
| 1953 | 94 | ||
| 1957 | |||
| 1961 | |||
| 1965 | 92 | Ahaus – Bocholt | |
| 1969 | |||
| 1972 | |||
| 1976 | |||
| 1980 | 96 | Borken |
|
| 1983 | |||
| 1987 | |||
| 1990 | Borken II | ||
| 1994 | |||
| 1998 | |||
| 2002 | 127 | ||
| 2005 | |||
| 2009 | |||
| 2013 | 126 | ||
| 2017 | |||
| 2021 |
Members
The constituency has been held continuously by the Christian Democratic Union (CDU) since its creation. It was first represented by Theodor Blank from 1949 to 1969. Hermann Josef Unland then served as representative from 1969 to 1990. Elke Wülfing served from 1990 to 2005. Johannes Röring was elected in 2005, and re-elected in 2009, 2013, and 2017.
| Election | Member | Party | % | |
|---|---|---|---|---|
| 1949 | Theodor Blank | CDU | 41.8 | |
| 1953 | 75.0 | |||
| 1957 | 74.2 | |||
| 1961 | 71.9 | |||
| 1965 | 71.2 | |||
| 1969 | Hermann Josef Unland | CDU | 66.6 | |
| 1972 | 64.0 | |||
| 1976 | 65.7 | |||
| 1980 | 60.8 | |||
| 1983 | 53.7 | |||
| 1987 | 45.6 | |||
| 1990 | Elke Wülfing | CDU | 59.1 | |
| 1994 | 55.6 | |||
| 1998 | 50.2 | |||
| 2002 | 51.5 | |||
| 2005 | Johannes Röring | CDU | 56.1 | |
| 2009 | 54.2 | |||
| 2013 | 57.4 | |||
| 2017 | 52.3 | |||
Election results
2017 election
| Federal election (2017): Borken II[3] | |||||||||
|---|---|---|---|---|---|---|---|---|---|
| Notes: |
Blue background denotes the winner of the electorate vote.
| ||||||||
| Party | Candidate | Votes | % | ±% | Party votes | % | ±% | ||
| CDU | 81,496 | 52.3 | 73,881 | 47.0 | |||||
| SPD | Ursula Schulte | 39,412 | 25.3 | 33,697 | 21.5 | ||||
| FDP | Karlheinz Busen | 14,216 | 9.1 | 20,609 | 13.1 | ||||
| AfD | 9,405 | 6.0 | |||||||
| Green | Holger Lordieck | 10,496 | 6.7 | 9,220 | 5.9 | ||||
| Left | Rolf Paul Christian Kohn | 6,969 | 4.5 | 6,540 | 4.2 | ||||
| Tierschutzpartei | 768 | 0.5 | |||||||
| PARTEI | 711 | 0.5 | |||||||
| FW | Markus Krafczyk | 3,182 | 2.0 | 553 | 0.4 | ||||
| Pirates | 441 | 0.3 | |||||||
| NPD | 195 | 0.1 | |||||||
| ÖDP | 156 | 0.1 | |||||||
| Gesundheitsforschung | 125 | 0.1 | |||||||
| AD-DEMOKRATEN | 123 | 0.1 | |||||||
| V-Partei³ | 108 | 0.1 | |||||||
| DM | 104 | 0.1 | |||||||
| Volksabstimmung | 100 | 0.1 | |||||||
| DiB | 99 | 0.1 | |||||||
| Die Humanisten | 76 | 0.0 | |||||||
| BGE | 65 | 0.0 | |||||||
| MLPD | 45 | 0.0 | |||||||
| DKP | 22 | 0.0 | |||||||
| SGP | 13 | 0.0 | |||||||
| Informal votes | 2,375 | 1,090 | |||||||
| Total Valid votes | 155,771 | 157,056 | |||||||
| Turnout | 158,146 | 79.1 | |||||||
| CDU hold | Majority | 42,084 | 27.0 | ||||||
2013 election
| Federal election (2013): Borken II[4] | |||||||||
|---|---|---|---|---|---|---|---|---|---|
| Notes: |
Blue background denotes the winner of the electorate vote.
| ||||||||
| Party | Candidate | Votes | % | ±% | Party votes | % | ±% | ||
| CDU | 86,028 | 57.4 | 80,352 | 53.5 | |||||
| SPD | Ursula Schulte | 40,643 | 27.1 | 38,391 | 25.5 | ||||
| Green | Frank Büning | 9,548 | 6.4 | 9,138 | 6.1 | ||||
| Left | Heidi Breuer | 4,513 | 3.0 | 5,447 | 3.6 | ||||
| FDP | Kevin Schneider | 3,389 | 2.3 | 7,915 | 5.3 | ||||
| Pirates | Siegfried Kerkhoff | 3,016 | 2.0 | 2,468 | 1.6 | ||||
| AfD | Alfred Heitmann | 2,849 | 1.9 | 4,042 | 2.7 | ||||
| NPD | 948 | 0.6 | |||||||
| PARTEI | 352 | 0.2 | |||||||
| FW | 248 | 0.2 | |||||||
| Volksabstimmung | 182 | 0.1 | |||||||
| PRO | 170 | 0.1 | |||||||
| ÖDP | 167 | 0.1 | |||||||
| Nichtwahler | 117 | 0.1 | |||||||
| REP | 103 | 0.1 | |||||||
| Party of Reason | 78 | 0.1 | |||||||
| RRP | 61 | 0.0 | |||||||
| BIG | 22 | 0.0 | |||||||
| PSG | 22 | 0.0 | |||||||
| BüSo | 17 | 0.0 | |||||||
| MLPD | 17 | 0.0 | |||||||
| Die Rechte | 12 | 0.0 | |||||||
| Informal votes | 1,401 | 1,118 | |||||||
| Total Valid votes | 149,986 | 150,269 | |||||||
| Turnout | 151,387 | 76.2 | |||||||
| CDU hold | Majority | 45,385 | 30.3 | ||||||
2009 election
| Federal election (2009): Borken II[5] | |||||||||
|---|---|---|---|---|---|---|---|---|---|
| Notes: |
Blue background denotes the winner of the electorate vote.
| ||||||||
| Party | Candidate | Votes | % | ±% | Party votes | % | ±% | ||
| CDU | 79,254 | 54.2 | 67,056 | 45.8 | |||||
| SPD | Christoph Pries | 37,324 | 25.5 | 32,344 | 22.1 | ||||
| FDP | Winfried Polch | 12,521 | 8.6 | 24,230 | 16.5 | ||||
| Green | Ludwig Artmeyer | 9,706 | 6.6 | 10,793 | 7.4 | ||||
| Left | Martin Rath | 6,385 | 4.4 | 7,222 | 4.9 | ||||
| Pirates | 1,823 | 1.2 | |||||||
| NPD | Sascha Andre Maier | 1,044 | 0.7 | 805 | 0.5 | ||||
| FAMILIE | 625 | 0.4 | |||||||
| Tierschutzpartei | 599 | 0.4 | |||||||
| RENTNER | 344 | 0.2 | |||||||
| REP | 188 | 0.1 | |||||||
| Centre | 103 | 0.1 | |||||||
| RRP | 100 | 0.1 | |||||||
| ÖDP | 94 | 0.1 | |||||||
| Volksabstimmung | 73 | 0.0 | |||||||
| DVU | 56 | 0.0 | |||||||
| MLPD | 17 | 0.0 | |||||||
| PSG | 13 | 0.0 | |||||||
| BüSo | 12 | 0.0 | |||||||
| Informal votes | 1,494 | 1,231 | |||||||
| Total Valid votes | 146,234 | 146,497 | |||||||
| Turnout | 147,728 | 75.1 | |||||||
| CDU hold | Majority | 41,930 | 28.7 | ||||||
References
- "Constituency Borken II". Federal Returning Officer.
- "Results for Borken II". Federal Returning Officer.
- Results for Borken II
- Results for Borken II
- Results for Borken II