Oxfordshire County Council elections
Oxfordshire County Council is elected every four years.
Political control
- Conservative 1973–1985
- No overall control 1985–2005
- Conservative 2005–2013
- No overall control 2013–present
Council elections
- 1973 Oxfordshire County Council election
- 1977 Oxfordshire County Council election
- 1981 Oxfordshire County Council election
- 1985 Oxfordshire County Council election
- 1989 Oxfordshire County Council election
- 1993 Oxfordshire County Council election
- 1997 Oxfordshire County Council election
- 2001 Oxfordshire County Council election
- 2005 Oxfordshire County Council election
- 2009 Oxfordshire County Council election
- 2013 Oxfordshire County Council election
- 2017 Oxfordshire County Council election
County result maps
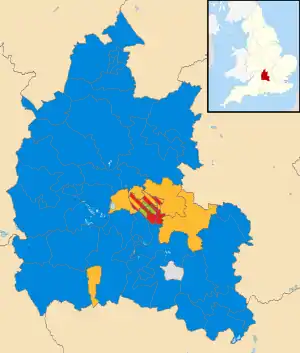
 2009 results map
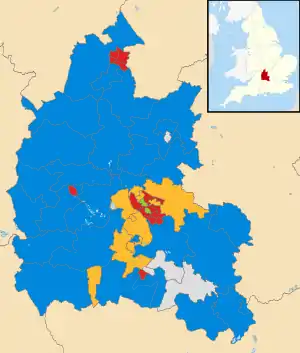
 2013 results map
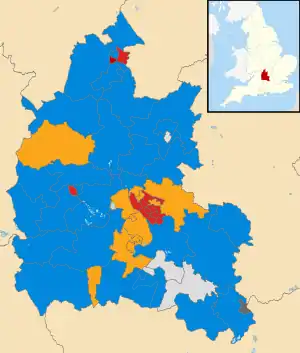
 2017 results map
By-election results
1997-2001
| Party | Candidate | Votes | % | ±% | |
|---|---|---|---|---|---|
| Liberal Democrats | 1,085 | 47.4 | +4.9 | ||
| Conservative | 582 | 25.4 | +0.4 | ||
| Labour | 352 | 15.4 | -5.7 | ||
| Green | 270 | 11.8 | +0.4 | ||
| Majority | 503 | 22.0 | |||
| Turnout | 2,289 | ||||
| Liberal Democrats hold | Swing | ||||
| Party | Candidate | Votes | % | ±% | |
|---|---|---|---|---|---|
| Liberal Democrats | 537 | 42.5 | -9.0 | ||
| Labour | 520 | 41.1 | +5.8 | ||
| Conservative | 124 | 9.8 | +1.3 | ||
| Green | 83 | 6.6 | +1.9 | ||
| Majority | 17 | 1.4 | |||
| Turnout | 1,264 | 22.8 | |||
| Liberal Democrats gain from Labour | Swing | ||||
| Party | Candidate | Votes | % | ±% | |
|---|---|---|---|---|---|
| Labour | 630 | 40.0 | -0.7 | ||
| Liberal Democrats | 597 | 37.9 | +8.1 | ||
| Green | 198 | 12.6 | -7.6 | ||
| Conservative | 127 | 8.1 | -1.2 | ||
| Independent | 22 | 1.4 | +1.4 | ||
| Majority | 33 | 2.1 | |||
| Turnout | 1,574 | 26.0 | |||
| Labour hold | Swing | ||||
| Party | Candidate | Votes | % | ±% | |
|---|---|---|---|---|---|
| Conservative | 348 | 48.0 | +27.0 | ||
| Labour | 314 | 43.9 | -20.1 | ||
| Liberal Democrats | 58 | 8.1 | -6.9 | ||
| Majority | 29 | 4.1 | |||
| Turnout | 715 | 12.8 | |||
| Conservative gain from Labour | Swing | ||||
| Party | Candidate | Votes | % | ±% | |
|---|---|---|---|---|---|
| Liberal Democrats | 731 | 47.0 | +19.8 | ||
| Conservative | 651 | 41.9 | -10.3 | ||
| Labour | 172 | 11.1 | -4.1 | ||
| Majority | 80 | 5.1 | |||
| Turnout | 1,554 | 26.0 | |||
| Liberal Democrats gain from Conservative | Swing | ||||
2001-2005
| Party | Candidate | Votes | % | ±% | |
|---|---|---|---|---|---|
| Liberal Democrats | 1,063 | 40.4 | +9.7 | ||
| Green | 769 | 29.2 | -5.2 | ||
| Conservative | 530 | 20.1 | +0.0 | ||
| Labour | 271 | 10.3 | -3.7 | ||
| Majority | 294 | 11.2 | |||
| Turnout | 2,633 | 47.4 | |||
| Liberal Democrats gain from Green | Swing | ||||
| Party | Candidate | Votes | % | ±% | |
|---|---|---|---|---|---|
| Conservative | 1,172 | 59.6 | +7.8 | ||
| Liberal Democrats | 588 | 30.0 | -7.0 | ||
| Labour | 205 | 10.4 | +10.4 | ||
| Majority | 584 | 29.6 | |||
| Turnout | 1,965 | 25.2 | |||
| Conservative hold | Swing | ||||
| Party | Candidate | Votes | % | ±% | |
|---|---|---|---|---|---|
| Liberal Democrats | 732 | 39.6 | +8.9 | ||
| Green | 693 | 37.5 | +3.1 | ||
| Conservative | 327 | 17.7 | -3.1 | ||
| Labour | 95 | 5.1 | -8.9 | ||
| Majority | 39 | 2.1 | |||
| Turnout | 1,847 | 31.9 | |||
| Liberal Democrats hold | Swing | ||||
| Party | Candidate | Votes | % | ±% | |
|---|---|---|---|---|---|
| Conservative | 1,070 | ||||
| Labour | 152 | ||||
| Green | 87 | ||||
| Majority | |||||
| Turnout | 29.0 | ||||
| Conservative hold | Swing | ||||
| Party | Candidate | Votes | % | ±% | |
|---|---|---|---|---|---|
| Conservative | 920 | 54.9 | -5.1 | ||
| Resident | 405 | 24.2 | +24.2 | ||
| Liberal Democrats | 118 | 7.0 | -19.7 | ||
| Independent | 103 | 6.1 | +6.1 | ||
| Green | 66 | 3.9 | -3.5 | ||
| Labour | 63 | 3.8 | -2.1 | ||
| Majority | 515 | 30.7 | |||
| Turnout | 1,675 | 26.0 | |||
| Conservative hold | Swing | ||||
| Party | Candidate | Votes | % | ±% | |
|---|---|---|---|---|---|
| Liberal Democrats | Colin James | 1,657 | 52.9 | +19.0 | |
| Conservative | Ian Hudspeth | 1,476 | 47.1 | +1.1 | |
| Majority | 181 | 5.8 | |||
| Turnout | 3,133 | 53.2 | |||
| Liberal Democrats gain from Conservative | Swing | ||||
2005-2009
| Party | Candidate | Votes | % | ±% | |
|---|---|---|---|---|---|
| Conservative | Carole Bonner | 880 | 51.5 | +14.4 | |
| Labour | Royston Mold | 488 | 28.6 | -6.3 | |
| Liberal Democrats | Choudry Anjum | 340 | 19.9 | -2.2 | |
| Majority | 392 | 22.9 | |||
| Turnout | 1,708 | 24.6 | |||
| Conservative hold | Swing | ||||
| Party | Candidate | Votes | % | ±% | |
|---|---|---|---|---|---|
| Conservative | Charles Mathew | 1,652 | 53.0 | +17.9 | |
| Liberal Democrats | Stuart Brooks | 1,034 | 33.2 | -11.1 | |
| Green | Xanthe Bevis | 254 | 8.2 | +1.2 | |
| Labour | Richard Kelsall | 176 | 5.6 | -8.0 | |
| Majority | 618 | 19.8 | |||
| Turnout | 3,116 | 43.9 | |||
| Conservative gain from Liberal Democrats | Swing | ||||
| Party | Candidate | Votes | % | ±% | |
|---|---|---|---|---|---|
| Conservative | Peter Handley | 934 | 67.5 | +15.8 | |
| Liberal Democrats | Peter Madden | 348 | 25.1 | -2.1 | |
| Labour | David Wesson | 102 | 7.4 | -10.6 | |
| Majority | 586 | 42.4 | |||
| Turnout | 1,384 | ||||
| Conservative hold | Swing | ||||
| Party | Candidate | Votes | % | ±% | |
|---|---|---|---|---|---|
| Liberal Democrats | Jenny Hannaby | 1,901 | 46.7 | +11.1 | |
| Conservative | Bill Melotti | 1,786 | 43.9 | +11.0 | |
| Labour | Jean Nunn-Price | 382 | 9.4 | -14.3 | |
| Majority | 115 | 2.8 | |||
| Turnout | 4,069 | ||||
| Liberal Democrats hold | Swing | ||||
| Party | Candidate | Votes | % | ±% | |
|---|---|---|---|---|---|
| Independent | Lynda Atkins | 867 | 65.6 | +65.6 | |
| Conservative | Patricia Dawe | 386 | 29.2 | -4.6 | |
| Labour | Charles Gill | 69 | 5.2 | -8.2 | |
| Majority | 481 | 36.4 | |||
| Turnout | 1,322 | 19.7 | |||
| Independent gain from Liberal Democrats | Swing | ||||
| Party | Candidate | Votes | % | ±% | |
|---|---|---|---|---|---|
| Conservative | Michael Gibbard | 2,921 | 52.2 | +13.7 | |
| Liberal Democrats | Suzanne Wilson-Higgins | 1,681 | 30.0 | -1.4 | |
| Labour | Chris Robins | 675 | 12.1 | -11.0 | |
| Green | Janet Warren | 321 | 5.7 | -1.3 | |
| Majority | 1,240 | 22.2 | |||
| Turnout | 5,598 | 39.5 | |||
| Conservative hold | Swing | ||||
External links
This article is issued from Wikipedia. The text is licensed under Creative Commons - Attribution - Sharealike. Additional terms may apply for the media files.