Chemnitz (electoral district)
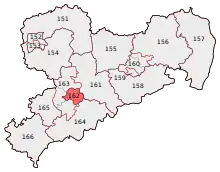
Chemnitz is an electoral constituency (German: Wahlkreis) represented in the Bundestag. It elects one member via first-past-the-post voting. Under the current constituency numbering system, it is designated as constituency 162. It is located in western Saxony, comprising the city of Chemnitz.[1]
| 162 Chemnitz | |
|---|---|
| electoral district for the Bundestag | |
 Chemnitz in 2013 | |
| State | Saxony |
| Population | 248,600 (2015) |
| Electorate | 195,929 (2017) |
| Major settlements | Chemnitz |
| Area | 221.0 km2 |
| Current electoral district | |
| Created | 1990 |
| Party | CDU |
| Member | Frank Heinrich |
| Elected | 2009, 2013, 2017 |
Chemnitz was created for the inaugural 1990 federal election after German reunification. Since 2009, it has been represented by Frank Heinrich of the Christian Democratic Union (CDU).[2]
Geography
Chemnitz is located in western Saxony. As of the 2021 federal election, it is coterminous with the independent city of Chemnitz.[1]
History
Chemnitz was created after German reunification in 1990, then known as Chemnitz I. It acquired its current name in the 2002 election. In the 1990 through 1998 elections, it was constituency 323 in the numbering system. In the 2002 and 2005 elections, it was number 164. In the 2009 election, it was number 163. Since 2013, it has been number 162.
Originally, the constituency comprised the Stadtbezirke of Mitte-Nord, West, and Süd I from the independent city of Chemnitz. It acquired its current borders in the 2002 election.
| Election | No. | Name | Borders |
|---|---|---|---|
| 1990 | 323 | Chemnitz I |
|
| 1994 | |||
| 1998 | |||
| 2002 | 164 | Chemnitz |
|
| 2005 | |||
| 2009 | 163 | ||
| 2013 | 162 | ||
| 2017 | |||
| 2021 |
Members
The constituency was first represented by Rudolf Meinl of the Christian Democratic Union (CDU) from 1990 to 1998. It was won by Jelena Hoffmann of the Social Democratic Party (SPD) in 1998. She was succeeded by fellow SPD member Detlef Müller in the 2005 election. Frank Heinrich of the CDU was elected in 2009, and re-elected in 2013 and 2017.
| Election | Member | Party | % | |
|---|---|---|---|---|
| 1990 | Rudolf Meinl | CDU | 43.1 | |
| 1994 | 43.1 | |||
| 1998 | Jelena Hoffmann | SPD | 32.4 | |
| 2002 | 35.0 | |||
| 2005 | Detlef Müller | SPD | 28.4 | |
| 2009 | Frank Heinrich | CDU | 34.1 | |
| 2013 | 41.7 | |||
| 2017 | 26.6 | |||
Election results
2017 election
| Federal election (2017): Chemnitz[3] | |||||||||
|---|---|---|---|---|---|---|---|---|---|
| Notes: |
Blue background denotes the winner of the electorate vote.
| ||||||||
| Party | Candidate | Votes | % | ±% | Party votes | % | ±% | ||
| CDU | 38,653 | 26.6 | 36,270 | 24.9 | |||||
| AfD | Nico Köhler | 34,958 | 24.0 | 35,456 | 24.3 | ||||
| Left | Michael Leutert | 28,213 | 19.4 | 28,010 | 19.2 | ||||
| SPD | Detlef Müller | 22,413 | 15.4 | 17,373 | 11.9 | ||||
| FDP | Frank Müller-Rosentritt | 9,535 | 6.6 | 12,184 | 8.4 | ||||
| Green | Meike Roden | 6,157 | 4.2 | 6,818 | 4.7 | ||||
| PARTEI | Paul Thomas Vogel | 3,432 | 2.4 | 2,746 | 1.9 | ||||
| Tierschutzpartei | 2,042 | 1.4 | |||||||
| NPD | 1,149 | 0.8 | |||||||
| FW | 1,068 | 0.7 | |||||||
| Pirates | Toni Rotter | 1,403 | 1.0 | 874 | 0.6 | ||||
| BGE | 478 | 0.3 | |||||||
| DiB | 407 | 0.3 | |||||||
| ÖDP | 308 | 0.2 | |||||||
| V-Partei³ | 277 | 0.2 | |||||||
| BüSo | Stephan Hochstein | 789 | 0.5 | 255 | 0.2 | ||||
| MLPD | 156 | 0.1 | |||||||
| Informal votes | 1,665 | 1,347 | |||||||
| Total Valid votes | 145,553 | 145,871 | |||||||
| Turnout | 147,218 | 75.1 | |||||||
| CDU hold | Majority | 3,695 | 2.6 | ||||||
2013 election
| Federal election (2013): Chemnitz[4] | |||||||||
|---|---|---|---|---|---|---|---|---|---|
| Notes: |
Blue background denotes the winner of the electorate vote.
| ||||||||
| Party | Candidate | Votes | % | ±% | Party votes | % | ±% | ||
| CDU | 55,909 | 41.7 | 52,380 | 38.9 | |||||
| Left | Michael Leutert | 31,992 | 23.8 | 31,014 | 23.1 | ||||
| SPD | Detlef Müller | 28,101 | 20.9 | 23,558 | 17.5 | ||||
| AfD | 8,138 | 6.0 | |||||||
| Green | Petra Zais | 6,475 | 4.8 | 7,168 | 5.3 | ||||
| NPD | Ines Schreiber | 4,661 | 3.5 | 3,135 | 2.3 | ||||
| Pirates | Toni Rotter | 2,808 | 2.1 | 3,298 | 2.5 | ||||
| FDP | Kristian Reinhold | 2,724 | 2.0 | 3,865 | 2.9 | ||||
| PARTEI | Tobias Göthert | 1,505 | 1.1 | ||||||
| FW | 1,081 | 0.8 | |||||||
| PRO | 537 | 0.4 | |||||||
| MLPD | 184 | 0.1 | |||||||
| BüSo | 170 | 0.1 | |||||||
| Informal votes | 1,701 | 1,348 | |||||||
| Total Valid votes | 134,175 | 134,528 | |||||||
| Turnout | 135,876 | 67.5 | |||||||
| CDU hold | Majority | 23,917 | 17.9 | ||||||
2009 election
| Federal election (2009): Chemnitz[5] | |||||||||
|---|---|---|---|---|---|---|---|---|---|
| Notes: |
Blue background denotes the winner of the electorate vote.
| ||||||||
| Party | Candidate | Votes | % | ±% | Party votes | % | ±% | ||
| CDU | Frank Heinrich | 45,876 | 34.1 | 41,081 | 30.5 | ||||
| Left | Michael Leutert | 37,433 | 27.9 | 38,448 | 28.6 | ||||
| SPD | 27,060 | 20.1 | 22,991 | 17.1 | |||||
| FDP | Robin John | 12,106 | 9.0 | 17,147 | 12.7 | ||||
| Green | Petra Zais | 8,109 | 6.0 | 9,524 | 7.1 | ||||
| NPD | Jörg Schubert | 3,800 | 2.8 | 3,651 | 2.7 | ||||
| BüSo | 813 | 0.6 | |||||||
| REP | 537 | 0.4 | |||||||
| MLPD | 305 | 0.2 | |||||||
| Informal votes | 1,716 | 1,603 | |||||||
| Total Valid votes | 134,384 | 134,497 | |||||||
| Turnout | 136,100 | 66.2 | |||||||
| CDU gain from SPD | Majority | 8,443 | 6.2 | ||||||
References
- "Constituency Chemnitz". Federal Returning Officer.
- "Results for Chemnitz". Federal Returning Officer.
- Results for Chemnitz
- Results for Chemnitz
- Results for Chemnitz
| Current | |
|---|---|
| Other states |
|
| See also | |