Görlitz (electoral district)
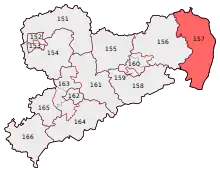
Görlitz is an electoral constituency (German: Wahlkreis) represented in the Bundestag. It elects one member via first-past-the-post voting. Under the current constituency numbering system, it is designated as constituency 157. It is located in eastern Saxony, comprising the Görlitz district.[1]
| 157 Görlitz | |
|---|---|
| electoral district for the Bundestag | |
 Görlitz in 2013 | |
| State | Saxony |
| Population | 260,000 (2015) |
| Electorate | 213,021 (2017) |
| Major settlements | Görlitz Zittau Weißwasser |
| Area | 2,111.4 km2 |
| Current electoral district | |
| Created | 1990 |
| Party | AfD |
| Member | Tino Chrupalla |
| Elected | 2017 |
Görlitz was created for the inaugural 1990 federal election after German reunification. Since 2017, it has been represented by Tino Chrupalla of the Alternative for Germany (AfD).[2]
Geography
Görlitz is located in eastern Saxony. As of the 2021 federal election, it is coterminous with the Görlitz district.[1]
History
Görlitz was created in 1990, then known as Görlitz – Zittau – Niesky. In the 2002 and 2005 elections, it was named Löbau-Zittau – Görlitz – Niesky. It acquired its current name in the 2009 election. In the 1990 through 1998 elections, it was constituency 315 in the numbering system. In the 2002 and 2005 elections, it was number 157. In the 2009 election, it was number 158. Since 2013, it has been number 157.
Originally, the constituency comprised the independent city of Görlitz and the districts of Landkreis Görlitz, Zittau, and Niesky. In the 2002 and 2005 elections, it comprised the independent city of Görlitz and the district of Löbau-Zittau, as well as the municipalities of Markersdorf, Niesky, Reichenbach, and Rothenburg, and the Verwaltungsverband of Weißer Schöps/Neiße from the district of Niederschlesischer Oberlausitzkreis. It acquired its current borders in the 2009 election.
Members
The constituency was first represented by Georg Janovsky of the Christian Democratic Union (CDU) from 1990 to 2002. He was succeeded by fellow CDU member Michael Kretschmer from 2002 to 2017. Tino Chrupalla of the AfD was elected in 2017.
| Election | Member | Party | % | |
|---|---|---|---|---|
| 1990 | Georg Janovsky | CDU | 53.5 | |
| 1994 | 56.9 | |||
| 1998 | 41.8 | |||
| 2002 | Michael Kretschmer | CDU | 40.6 | |
| 2005 | 38.5 | |||
| 2009 | 42.4 | |||
| 2013 | 49.6 | |||
| 2017 | Tino Chrupalla | AfD | 32.4 | |
Election results
2017 election
| Federal election (2017): Görlitz[3] | |||||||||
|---|---|---|---|---|---|---|---|---|---|
| Notes: |
Blue background denotes the winner of the electorate vote.
| ||||||||
| Party | Candidate | Votes | % | ±% | Party votes | % | ±% | ||
| AfD | Tino Chrupalla | 49,834 | 32.4 | 50,551 | 32.9 | ||||
| CDU | 48,256 | 31.4 | 41,000 | 26.7 | |||||
| Left | Thorsten Ahrens | 20,853 | 13.6 | 21,534 | 14.0 | ||||
| SPD | Thomas Jurk | 16,801 | 10.9 | 14,249 | 9.3 | ||||
| FDP | Christine Schlagehan | 7,661 | 5.0 | 10,810 | 7.0 | ||||
| Green | Joachim Schulze | 4,995 | 3.3 | 4,476 | 2.9 | ||||
| FW | Steffen Große | 3,521 | 2.3 | 2,464 | 1.6 | ||||
| NPD | 2,337 | 1.5 | |||||||
| Tierschutzpartei | 2,285 | 1.5 | |||||||
| PARTEI | 1,444 | 0.9 | |||||||
| BGE | 658 | 0.4 | |||||||
| Pirates | 516 | 0.3 | |||||||
| ÖDP | 368 | 0.2 | |||||||
| BüSo | Ilias Papadopulos | 1,722 | 1.1 | 362 | 0.2 | ||||
| DiB | 290 | 0.2 | |||||||
| V-Partei³ | 248 | 0.2 | |||||||
| MLPD | 128 | 0.1 | |||||||
| Informal votes | 2,446 | 2,369 | |||||||
| Total Valid votes | 153,643 | 153,720 | |||||||
| Turnout | 156,089 | 73.3 | |||||||
| AfD gain from CDU | Majority | 1,578 | 1.0 | ||||||
2013 election
| Federal election (2013): Görlitz[4] | |||||||||
|---|---|---|---|---|---|---|---|---|---|
| Notes: |
Blue background denotes the winner of the electorate vote.
| ||||||||
| Party | Candidate | Votes | % | ±% | Party votes | % | ±% | ||
| CDU | 74,204 | 49.6 | 66,106 | 44.1 | |||||
| Left | Ilja Seifert | 29,550 | 19.7 | 29,380 | 19.6 | ||||
| SPD | Thomas Jurk | 22,741 | 15.2 | 18,839 | 12.6 | ||||
| AfD | 12,331 | 8.2 | |||||||
| NPD | Per Lennart Aae | 8,323 | 5.6 | 6,360 | 4.2 | ||||
| Green | Joachim Schulze | 5,045 | 3.4 | 5,044 | 3.4 | ||||
| Pirates | Manfred Stöckert | 3,878 | 2.6 | 3,259 | 2.2 | ||||
| FDP | Daniel Breutmann | 2,442 | 1.6 | 4,185 | 2.8 | ||||
| FW | 2,577 | 1.7 | |||||||
| BüSo | Siegmar John | 2,069 | 1.4 | 685 | 0.5 | ||||
| BGD | Eleonore Rau | 1,431 | 1.0 | ||||||
| PRO | 1,023 | 0.7 | |||||||
| MLPD | 172 | 0.1 | |||||||
| Informal votes | 3,261 | 2,983 | |||||||
| Total Valid votes | 149,683 | 149,961 | |||||||
| Turnout | 152,944 | 68.4 | |||||||
| CDU hold | Majority | 44,654 | 29.9 | ||||||
2009 election
| Federal election (2009): Görlitz[5] | |||||||||
|---|---|---|---|---|---|---|---|---|---|
| Notes: |
Blue background denotes the winner of the electorate vote.
| ||||||||
| Party | Candidate | Votes | % | ±% | Party votes | % | ±% | ||
| CDU | 62,338 | 42.4 | 55,015 | 37.4 | |||||
| Left | Ilja Seifert | 35,786 | 24.3 | 36,231 | 24.6 | ||||
| SPD | Wolfgang Gunkel | 17,005 | 11.6 | 18,569 | 12.6 | ||||
| FDP | Toralf Einsle | 13,935 | 9.5 | 19,223 | 13.1 | ||||
| NPD | Per Lennart Aae | 7,842 | 5.3 | 8,035 | 5.5 | ||||
| Green | Joachim Schulze | 7,381 | 5.0 | 7,004 | 4.8 | ||||
| BüSo | Siegmar John | 2,700 | 1.8 | 2,117 | 1.4 | ||||
| REP | 540 | 0.4 | |||||||
| MLPD | 413 | 0.3 | |||||||
| Informal votes | 2,750 | 2,590 | |||||||
| Total Valid votes | 146,987 | 147,147 | |||||||
| Turnout | 149,737 | 62.7 | |||||||
| CDU hold | Majority | 26,552 | 18.1 | ||||||
References
- "Constituency Görlitz". Federal Returning Officer.
- "Results for Görlitz". Federal Returning Officer.
- Results for Görlitz
- Results for Görlitz
- Results for Görlitz
| Current | |
|---|---|
| Other states |
|
| See also | |