Colorado's 6th congressional district
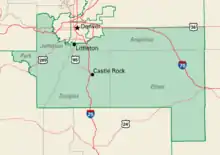
Colorado's 6th congressional district is a congressional district in the U.S. state of Colorado. Located in central Colorado, the district encompasses much of the eastern part of the Denver metropolitan area, including all of Aurora, as well as portions of the southern (Centennial and Littleton) and northern metro area (Brighton and Henderson).
| Colorado's 6th congressional district | |||
|---|---|---|---|
.tif.png.webp) Colorado's 6th congressional district since January 3, 2013 | |||
| Representative |
| ||
| Distribution |
| ||
| Population (2019) | 828,201[2] | ||
| Median household income | $87,312[3] | ||
| Ethnicity |
| ||
| Cook PVI | D+2[4] | ||
The district is currently represented by Democrat Jason Crow.
The district was created in 1983, and was originally a classic suburban Republican bastion; this was once the safest seat for Colorado Republicans outside of Colorado Springs. However, changing demographics in the Front Range, with a large growth in the minority population (especially Hispanics), has made suburban Denver much friendlier to Democrats. The 2010 redistricting shifted the more rural, GOP-dominated sections of the district to the nearby 4th, turning the 6th district into a Democratic-leaning swing district. However, Republicans are still competitive downballot.
History
1990s
Following the 1990 U.S. Census and associated realignment of Colorado congressional districts, the 6th Congressional district consisted of portions of Arapahoe and Jefferson counties.
2000s
Following the 2000 U.S. Census and associated realignment of Colorado congressional districts, the 6th Congressional district consisted of Douglas and Elbert counties as well as portions of Arapahoe, Jefferson, and Park counties.
2010s
During the 2010 Colorado Redistricting, the 6th Congressional district lost most of its current area; the district now consists of the western portions of Arapahoe and Adams counties plus the community of Highlands Ranch in Douglas County.
Characteristics
A suburban swing district anchored by Aurora, Republicans are the strongest in the Adams County and Douglas County portions of the district (such as Brighton, Parker and Highlands Ranch), while the Democrats are strongest in the Arapahoe suburbs (Aurora, Centennial and Englewood).
Voting
Election results from presidential races[5]
| Election results from presidential races | ||
|---|---|---|
| Year | Office | Results |
| 2000 | President | Bush 60–37% |
| 2004 | President | Bush 60–39% |
| 2008 | President | McCain 53–46% |
| 2012 | President | Obama 52–47% |
| 2016 | President | Clinton 50–41% |
| 2020 | President | Biden 58–39% |
List of members representing the district


Election results
|
1982 • 1983 (Special) • 1984 • 1986 • 1988 • 1990 • 1992 • 1994 • 1996 • 1998 • 2000 • 2002 • 2004 • 2006 • 2008 • 2010 • 2012 • 2014 • 2016 • 2018 • 2020 |
1982
| Party | Candidate | Votes | % | ||
|---|---|---|---|---|---|
| Republican | Jack Swigert | 98,909 | 62.16% | ||
| Democratic | Steve Hogan | 56,598 | 35.57% | ||
| Libertarian | J. Craig Green | 3,605 | 2.27% | ||
| Total votes | 159,112 | 100% | |||
| Republican win (new seat) | |||||
1983 (Special)
| Party | Candidate | Votes | % | |
|---|---|---|---|---|
| Republican | Daniel Schaefer | 49,816 | 63.29% | |
| Democratic | Steve Hogan | 27,779 | 35.29% | |
| Concerns of People Party | John Heckman | 1,112 | 1.41% | |
| Total votes | 78,707 | 100% | ||
| Republican hold | ||||
1984
| Party | Candidate | Votes | % | |
|---|---|---|---|---|
| Republican | Daniel Schaefer (incumbent) | 171,427 | 89.40% | |
| Concerns of People Party | John Heckman | 20,333 | 10.60% | |
| Total votes | 191,760 | 100% | ||
| Republican hold | ||||
1986
| Party | Candidate | Votes | % | |
|---|---|---|---|---|
| Republican | Daniel Schaefer (incumbent) | 104,359 | 65.01% | |
| Democratic | Chuck Norris | 58,834 | 36.65% | |
| Concerns of People Party | John Heckman | 2,338 | 1.46% | |
| Total votes | 160,531 | 100% | ||
| Republican hold | ||||
1988
| Party | Candidate | Votes | % | |
|---|---|---|---|---|
| Republican | Daniel Schaefer (incumbent) | 136,487 | 63.03% | |
| Democratic | Martha Ezzard | 77,158 | 35.63% | |
| Concerns of People Party | John Heckman | 2,911 | 1.34% | |
| Total votes | 216,556 | 100% | ||
| Republican hold | ||||
1990
| Party | Candidate | Votes | % | |
|---|---|---|---|---|
| Republican | Daniel Schaefer (incumbent) | 105,312 | 64.50% | |
| Democratic | Don Jarrett | 57,961 | 35.50% | |
| Total votes | 163,273 | 100% | ||
| Republican hold | ||||
1992
| Party | Candidate | Votes | % | |
|---|---|---|---|---|
| Republican | Daniel Schaefer (incumbent) | 142,021 | 60.93% | |
| Democratic | Tom Kolbe | 91,073 | 39.07% | |
| Prohibition | Earl Higgerson (write-in) | 3 | 0.00% | |
| Total votes | 233,097 | 100% | ||
| Republican hold | ||||
1994
| Party | Candidate | Votes | % | |
|---|---|---|---|---|
| Republican | Daniel Schaefer (incumbent) | 124,079 | 69.82% | |
| Democratic | John Hallen | 49,701 | 27.97% | |
| Concerns of People Party | John Heckman | 2,536 | 1.43% | |
| Natural Law | Stephen D. Dawson | 1,393 | 0.78% | |
| Total votes | 177,709 | 100% | ||
| Republican hold | ||||
1996
| Party | Candidate | Votes | % | |
|---|---|---|---|---|
| Republican | Daniel Schaefer (incumbent) | 146,018 | 62.24% | |
| Democratic | Joan Fitz-Gerald | 88,600 | 37.76% | |
| Total votes | 234,618 | 100% | ||
| Republican hold | ||||
1998
| Party | Candidate | Votes | % | |
|---|---|---|---|---|
| Republican | Tom Tancredo | 111,374 | 55.91% | |
| Democratic | Henry L. Strauss | 82,622 | 41.48% | |
| Natural Law | George E. Newman | 5,152 | 2.59% | |
| Total votes | 199,188 | 100% | ||
| Republican hold | ||||
2000
| Party | Candidate | Votes | % | |
|---|---|---|---|---|
| Republican | Tom Tancredo (incumbent) | 141,410 | 53.88% | |
| Democratic | Kenneth A. Toltz | 110,568 | 42.12% | |
| Libertarian | Adam David Katz | 6,882 | 2.62% | |
| Concerns of People Party | John Heckman | 3,614 | 1.38% | |
| Total votes | 262,477 | 100% | ||
| Republican hold | ||||
2002
| Party | Candidate | Votes | % | |
|---|---|---|---|---|
| Republican | Tom Tancredo (incumbent) | 158,851 | 66.88% | |
| Democratic | Lance Wright | 71,327 | 30.03% | |
| Libertarian | Adam David Katz | 7,323 | 3.08% | |
| Total votes | 237,501 | 100% | ||
| Republican hold | ||||
2004
| Party | Candidate | Votes | % | |
|---|---|---|---|---|
| Republican | Tom Tancredo (incumbent) | 212,778 | 59.48% | |
| Democratic | Joanna Conti | 139,870 | 39.10% | |
| Libertarian | Jack J. Woehr | 3,857 | 1.08% | |
| Constitution | Peter Shevchuck | 1,235 | 0.35% | |
| Total votes | 357,741 | 100% | ||
| Republican hold | ||||
2006
| Party | Candidate | Votes | % | |
|---|---|---|---|---|
| Republican | Tom Tancredo (incumbent) | 158,806 | 58.61% | |
| Democratic | Bill Winter | 108,007 | 39.87% | |
| Libertarian | Jack J. Woehr | 4,093 | 1.51% | |
| Republican | Juan B. Botero (write-in) | 25 | 0.01% | |
| Total votes | 270,931 | 100% | ||
| Republican hold | ||||
Republican primary
| Party | Candidate | Votes | % | |
|---|---|---|---|---|
| Republican | Mike Coffman | 28,509 | 40.12% | |
| Republican | Wil Armstrong | 23,213 | 32.67% | |
| Republican | Ted Harvey | 10,886 | 15.32% | |
| Republican | Steve Ward | 8,452 | 11.89% | |
| Total votes | 71,060 | 100% | ||
General election
| Party | Candidate | Votes | % | |
|---|---|---|---|---|
| Republican | Mike Coffman | 250,877 | 60.67% | |
| Democratic | Hank Eng | 162,641 | 39.33% | |
| Total votes | 413,516 | 100% | ||
| Republican hold | ||||
2010
| Party | Candidate | Votes | % | |
|---|---|---|---|---|
| Republican | Mike Coffman (incumbent) | 217,400 | 65.67% | |
| Democratic | John Flerlage | 104,159 | 31.46% | |
| Libertarian | Rob McNealy | 9,471 | 2.86% | |
| Write-in | Michael Shawn Kearns | 7 | 0.00% | |
| Total votes | 331,037 | 100% | ||
| Republican hold | ||||
2012
| Party | Candidate | Votes | % | |
|---|---|---|---|---|
| Republican | Mike Coffman (incumbent) | 163,938 | 47.81% | |
| Democratic | Joe Miklosi | 156,937 | 45.77% | |
| Libertarian | Patrick E. Provost | 8,597 | 2.51% | |
| UNA | Kathy Polhemus | 13,442 | 3.92% | |
| Total votes | 342,914 | 100% | ||
| Republican hold | ||||
2014
| Party | Candidate | Votes | % | |
|---|---|---|---|---|
| Republican | Mike Coffman (incumbent) | 143,467 | 51.90% | |
| Democratic | Andrew Romanoff | 118,847 | 42.99% | |
| Libertarian | Norm Olsen | 8,623 | 3.12% | |
| Green | Gary Swing | 5,503 | 1.99% | |
| Total votes | 276,440 | 100% | ||
| Republican hold | ||||
2016
| Party | Candidate | Votes | % | |
|---|---|---|---|---|
| Republican | Mike Coffman (incumbent) | 191,626 | 50.91% | |
| Democratic | Morgan Carroll | 160,372 | 42.60% | |
| Libertarian | Norm Olsen | 18,778 | 4.99% | |
| Green | Robert Lee Worthey | 5,641 | 1.50% | |
| Total votes | 376,417 | 100% | ||
| Republican hold | ||||
2018
| Party | Candidate | Votes | % | |||
|---|---|---|---|---|---|---|
| Democratic | Jason Crow | 184,399 | 54.08% | |||
| Republican | Mike Coffman (incumbent) | 146,339 | 42.92% | |||
| Libertarian | Kat Martin | 5,733 | 1.68% | |||
| Independent | Dan Chapin | 4,512 | 1.32% | |||
| Total votes | 340,983 | 100% | ||||
| Democratic gain from Republican | ||||||
2020
| Party | Candidate | Votes | % | |
|---|---|---|---|---|
| Democratic | Jason Crow (incumbent) | 250,314 | 57.09% | |
| Republican | Steve House | 175,192 | 39.96% | |
| Libertarian | Norm Olsen | 9,083 | 2.07% | |
| Unity | Jaimie Kulikowski | 3,884 | 0.89% | |
| Total votes | 438,473 | 100% | ||
| Democratic hold | ||||
Historical district boundaries
References
- https://www.census.gov/geo/maps-data/data/cd_state.html
- https://www.census.gov/mycd/?st=08&cd=05
- https://www.census.gov/mycd/?st=08&cd=06
- "Partisan Voting Index – Districts of the 115th Congress" (PDF). The Cook Political Report. April 7, 2017. Retrieved April 7, 2017.
- Presidential Election Results, by district, swingstateproject.com
- "Ex-Astronaut, Newly Elected to House, Dies". The Times. Shreveport, Louisiana. Associated Press. December 29, 1982. p. 12D – via Newspapers.com.
- 1982 Election Results
- 1983 Special Election Results
- 1984 Election Results
- 1986 Election Results
- 1988 Election Results
- 1990 Election Results
- 1992 Election Results
- 1994 Election Results
- 1996 Election Results
- 1998 Election Results
- 2000 Election Results
- 2002 Election Results
- 2004 Election Results
- 2006 Election Results
- 2008 Primary Results
- 2008 Election Results
- "2010 Election Results". Archived from the original on 2010-11-29. Retrieved 2011-07-21.
- 2012 Election Results
- "Official Results November 4, 2014 General Election". Colorado Secretary of State. Retrieved 2014-12-11.
- "Official Certified Results November 8, 2016 General Election". Colorado Secretary of State. Retrieved 2017-01-15.