Crime in London
Rates of crime in London have been increasing in every reporting year since 2015–2016,[1] whereby London is currently "experiencing an upsurge in serious violent crime, particularly among teenagers and young men".[2] In figures released by the Office for National Statistics (ONS), crime in London was five times higher than the rest of the United Kingdom in 2019. London saw a 28 percent increase in killings involving the use of a blade from 67 fatalities in 2018 to 86 in 2019.[3]
.jpg.webp)
While knife crime in London fell for three years in a row, down from 14,159 in 2010–2011 to 9,680 in 2014–15, under Boris Johnson's tenure as Mayor of London, his successor, Sadiq Khan, has presided over an increase in knife crime to 12,061 offences in 2016–17 and 14,695 in 2017–18.[4] In February 2018, reported murders in London exceeded those in New York City for the first time.[5] London recorded 45 murders during January through March 2018 whereas New York recorded 38.[6] According to a London Assembly report, hate crime has also increased significantly in London since 2018. Over 19,000 hate crimes were recorded in the capital in 2018, with an average of more than 52 per day.[7]
Greater London is generally served by three police forces; the Metropolitan Police which is responsible for policing the vast majority of the capital, the City of London Police which is responsible for The Square Mile of the City of London, and the British Transport Police which polices the national rail network and the London Underground. A fourth police force in London, the Ministry of Defence Police, do not generally become involved with policing the general public. London also has a number of small constabularies for policing parks. Within the Home Office crime statistic publications Greater London is referred to as the London Region.
 |
Violent crime

Offences categorised as "violent crime" by the Home Office are violence against the person,[8] including robbery and sexual offences. Sometimes includes kidnapping. It was announced in September 2018 that the city planned to emulate Scotland's public health approach, inspired by Cure Violence in Chicago, to violent crime. This saw the murder rate in Glasgow drop by more than a half between 2004 and 2017. In 2018 Sadiq Khan announced funding of £500,000 for a Violence Reduction Unit, though this has been criticised as insufficient.[9]
Homicide
Between 1990 and 2003 the number of homicides—i.e. murder, manslaughter, etc.—in London averaged 120 per year, with a low of 109 in 1996, and a high of 204 in 2003. The number then fell in each and every year between 2004 and 2014 to a new low of 83. They then rose sharply to 118 in 2015 and 110 in 2016.[n 1] In 2017 there was a further rise to 131, although this included the combined 14 victims of the Westminster Bridge (5), London Bridge (8), and Finsbury Park (1) terrorist attacks, but even with these major events was still lower than any year between 1990 and 2009.[22] As of 31 December 2018, there have been 132 homicides reported in London in 2018.[23] The year 2019 was reportedly London's bloodiest year since more than a decade, which recorded a 11-year high of 143 people being killed.[24][25] As of 31 December 2019, the number of homicides reported reached 149, the highest in a decade.[26]
| Year | 1990 | 1991 | 1992 | 1993 | 1994 | 1995 | 1996 | 1997 | 1998 | 1999 | 2000 | 2001 | 2002 | 2003 | 2004 | 2005 | 2006 | 2007 | 2008 | 2009 | 2010 | 2011 | 2012 | 2013 | 2014 | 2015 | 2016 | 2017 | 2018 | 2019 |
| Number of homicides in London[27][28] | 119 | 114 | 140 | 122 | 169 | 167 | 139 | 130 | 159 | 166 | 181 | 194 | 216 | 221 | 194 | 165 | 174 | 163 | 154 | 129 | 124 | 118 | 104 | 107 | 94 | 115 | 108 | 118 | 135 | 149 |
| Homicide Rate (per 100,000) | 1.7 | 2.1 | 1.8 | 2.1 | 2.1 | 2.4 | 2.0 | 2.3 | 2.3 | 2.5 | 2.4 | 2.9 | 3.0 | 2.6 | 2.2 | 2.3 | 2.1 | 2.0 | 1.6 | 1.5 | 1.5 | 1.3 | 1.3 | 1.1 | 1.3 | 1.2 | 1.3 | 1.5 | 1.7 | |
| London Population (thousands)[29] | 6,829 | 6,829 | 6,844 | 6,874 | 6,913 | 6,974 | 7,015 | 7,065 | 7,154 | 7,237 | 7,322 | 7,350 | 7,386 | 7,414 | 7,476 | 7,559 | 7,646 | 7,753 | 7,878 | 8,003 | 8,125 | 8,257 | 8,245 | 8,478 | 8,603 | 8,718 | 8,796 | 8,900 | 8,982 |
Although the homicide rate in London has been increasing year on year since 2014, its homicide rate is still much lower than other cities like NYC and Toronto. Still England is a relatively safe country by European standards, and exponentially safer than any North American Country, or city. Comparisons can be made to other world cities. Statistically London is over 2.5x as safe as cities like NYC and Toronto, in terms of Homicide, however the general crime rate is much similar.
| Number of homicides in 2017 | Homicide Rate | Population (thousands) | |
| London | 118 | 1.3 | 8,825 |
| Berlin[30] | 91 | 2.6 | 3,500 |
| Madrid[30] | 39 | 1.2 | 3,200 |
| Rome (2016)[30] | 21 | 0.7 | 2,900 |
| Amsterdam[30] | 19 | 2.3 | 813 |
The distribution of homicide offences in London can vary significantly by borough. Between 2000 and 2015 there were 2,326 offences committed in London. The murder rate increased 25.5% in between 2014 and 2015. Albeit, the 2015 total is still lower than most recent years prior, and the increase came from a relatively low count in 2014.[31]
| Rank | Borough | Number of homicides 2000 to 2012 |
|---|---|---|
| 1 | Lambeth | 154 |
| 2 | Southwark | 124 |
| 3 | Newham | 122 |
| 4 | Hackney | 114 |
| 5 | Brent | 100 |
| 6 | Haringey | 97 |
| 7 | Croydon | 87 |
| 8 | Camden | 85 |
| 9 | Ealing | 84 |
| 10 | Lewisham | 83 |
| 11 | Tower Hamlets | 83 |
| 12 | Waltham Forest | 73 |
| 13 | Greenwich | 71 |
| 14 | Islington | 70 |
| 15 | Enfield | 66 |
| 16 | Westminster | 63 |
| 17 | Wandsworth | 62 |
| 18 | Hillingdon | 61 |
| 19 | Barnet | 48 |
| 20 | Hammersmith and Fulham | 48 |
| 21 | Hounslow | 42 |
| 22 | Barking & Dagenham | 42 |
| 23 | Bromley | 38 |
| 24 | Redbridge | 38 |
| 25 | Bexley | 30 |
| 26 | Havering | 28 |
| 27 | Merton | 26 |
| 28 | Sutton | 25 |
| 29 | Harrow | 24 |
| 30 | Kensington & Chelsea | 23 |
| 31 | Kingston upon Thames | 17 |
| 32 | Richmond upon Thames | 14 |
Moped crime
A noted trend since 2014 is robberies and assaults committed by individuals riding mopeds; Crime involving mopeds has gone up by more than 600% in London in the past two years.[32]
Assault with injury
Assault with injury, currently comprising assault occasioning actual bodily harm and grievous bodily harm by the Metropolitan Police, accounts for on average 40% of all violence against the person offences within the Metropolitan Police area and 45% of all violence against the person nationally.[33] In England and Wales, 'assault without injury' and harassment account for a further 38% of crimes recorded within the violence against the person category.
In 2008–09, there 70,962 assault with injury offences in London with a rate of 9.5 per 1,000 residents.[34] This was slightly higher than the total rate for England and Wales, which was 7.0 per 1,000 residents.[35]
| Crime rate | 2000–01 | 2001–02 | 2002–03 | 2003–04 | 2004–05 | 2005–06 | 2006–07 | 2007–08 | 2008–09 |
|---|---|---|---|---|---|---|---|---|---|
| ABH and GBH rate per 1,000 London | 5.6 | 5.6 | 5.6 | 5.8 | 9.4 | 11.2 | 10.4 | 9.5 | 9.5 |
| ABH and GBH rate per 1,000 England & Wales | 3.6 | 3.8 | 6.2 | 7.6 | 8.6 | 9.0 | 8.4 | 7.5 | 7.0 |
Following the changes introduced by the National Crime Recording Standard (NCRS) in 2002, the way assaults were categorised was dependent on injury, leading to a significant jump in combined ABH and GBH figures nationally in 2002–03. Prior to NCRS, minor injuries were counted as common assault, while after NCRS any assault with injury would be categorised as ABH. Looking at figures over time is of limited value as figures prior to 2002–03 are not comparable with the way certain violent crimes have been recorded since then. These changes were not reflected in the Metropolitan Police performance figures until 2004/05, when the rate almost doubled to 9.4 per 1,000 residents compared to 5.8 the previous year. In 2005–06, the rate of recorded ABH and GBH peaked both nationally and within the Metropolitan Police force area according to recorded statistics.
The British Crime Survey or BCS is a systematic victim study, currently carried out by BMRB Limited on behalf of the Home Office. The BCS seeks to measure the amount of crime in England and Wales by asking around 50,000 people aged 16 and over, living in private households, about the crimes they have experienced in the last year. The survey is comparable to the National Crime Victimization Survey conducted in the United States. The Home Office estimated that just 37% of violence with injury offences were reported to and recorded by police.
An advantage of the BCS is that it has not been affected by the changes in counting rules and the way crime is categorised because it is survey-based. This makes it possible to observe national trends in crime over time. Crime in England and Wales 2008/09,[37] shows BCS violence with injury to have peaked in 1995 and declined steadily since then. Between 1995 and 2008–09, the BCS estimates that violence with injury offences decreased 53.6% across England & Wales.
Gun and knife crime
Weapon-enabled crimes are recorded by the Metropolitan Police when a weapon is used to assist a crime, for example a gun being used as part of a robbery. Recorded gun- and knife-enabled offences in London account for about 2% of total recorded crime. The two London Boroughs with the highest rate of gun and knife crime are Southwark and Lambeth. Other London Boroughs with high gun and knife crime rates include Brent, Haringey and Hackney.[38] Gun-enabled crime figures are displayed on the Metropolitan Police website at borough level expressed as financial year to date comparisons[39] but they are seldom made available for historical comparisons. Figures are available for calendar years 2000 to 2007[40] as shown in the table below.[39][41]
| Crime rate | 1999 | 2000 | 2001 | 2002 | 2003 | 2004 | 2005 | 2006 | 2007 | 2008 | 2009 |
|---|---|---|---|---|---|---|---|---|---|---|---|
| Gun-enabled crime | 2961 | 3250 | 4005 | 4444 | 4025 | 3744 | 3881 | 3327 | 3459 | 2525 | 3295 |
| Rate per 10,000 London | 3.9 | 4.3 | 5.3 | 5.9 | 5.4 | 4.9 | 5.2 | 4.4 | 4.6 | 3.4 | 4.4 |
Since 2000 there has been consistent fluctuations in the number of gun-enabled crimes recorded by the Metropolitan Police which peaked in 2003 when there were 4,444 recorded offences. The lowest number of offences recorded was potentially in 2008 where there were just 1,980 gun-enabled crimes between December 2007 and November 2008, an unusually low figure in comparison to other years. Since then however gun-enabled crime has increased 67% across London with 3,309 offences being recorded in the 12 months to November 2009.
| Crime rate | 2003 | 2004 | 2005 | 2006 | 2007 | 2008–09 | 2009–10 |
|---|---|---|---|---|---|---|---|
| Knife-enabled crime[41] | 10305 | 12985 | 12367 | 12301 | 10699 | 12345 | 12611 |
| Rate per 10,000 London | 13.7 | 17.3 | 16.5 | 16.4 | 14.3 | 16.4 | 16.8 |
Knife-enabled crime figures are available from 2003 to 2007 and more recently monthly knife crime summaries are provided on the Metropolitan Police website showing financial year to date figures.[42] Knife enabled offences increased from 2003 to 2004 and from then on saw annual reductions until 2007. It was not possible to retrieve statistics for 2008 and 2009.
The Metropolitan Police a number of operations that concentrate on knife and gun crime. They include Operation Trident and Trafalgar which deal with fatal and non-fatal shootings across London, Operation Blunt which was initially launched across 12 boroughs in 2004 to tackle knife crime and subsequently rolled out across the forces 32 boroughs in 2005 after early successes.[43] Operation Blunt was re-launched as Operation Blunt II in 2008 with the aim of tackling serious youth violence.[44] In addition to this there is the Specialist Firearms Command formerly known as SO19.
There has been an overall increase of crime rate especially knife stabbings from April 2010 (1093) to November 2018 (1208).[45] Mayor of London, Sadiq Khan said that the knife crime offenders will be tagged with tracking GPS devices for a year upon their release from the prison which will record their movements against the location of reported crimes & revert to police with the information.[46]
Robbery

Recording of robbery offences in England and Wales are sub-divided into Business Robbery (robbery of a business, e.g. a bank robbery) and Personal Robbery (taking an individuals personal belongings with force/threat).[47] Annually business robbery offences in London account for on average 10% of total robbery offences.
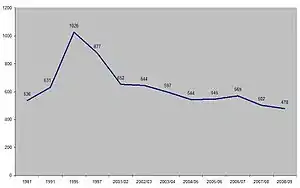
| Crime Rate | 1996 | 1997 | 1998 | 1999 | 2000–01 | 2001–02 | 2002–03 | 2003–04 | 2004–05 | 2005–06 | 2006–07 | 2007–08 | 2008–09 | 2009–10 | 2010–11 |
|---|---|---|---|---|---|---|---|---|---|---|---|---|---|---|---|
| London Robbery Offences[48][49][50][51] | 32867 | 28442 | 26330 | 32924 | 40992 | 53547 | 42496 | 40640 | 39033 | 45311 | 45771 | 37000 | 32555 | 33463 | 35857 |
| Rate per 1,000 London | 4.4 | 3.8 | 3.5 | 4.4 | 5.5 | 7.1 | 5.7 | 5.4 | 5.2 | 6.0 | 6.1 | 4.9 | 4.3 | 4.5 | 4.4 |
Robbery offending across London fell almost 20% between 1996 and 1998 from 32,867 to 26,330 offences. Following changes in counting rules of crimes and the later introduction of the National Crime Recording Standard offences of robbery rose both nationally and within London.[52] In London offences increased by 25% in 1999 compared with 1998. There was a 25% increase between 1999 and 2000/01 and a further 30% increase between 2000/01 and 2001/02 when the robbery rate in London peaked to 7.1 offences per 1,000 population. In March 2002 the government launched the 'Street Crime Initiative' with the aim of reducing robbery in the most affected police forces, including the Metropolitan Police. Nationally the 'Street Crime Initiative' achieved a reduction in robbery of 32% by March 2005.[53] In London during the same period robbery reduced by 27% from 53,547 in 2001/02 to 39,033 in 2004/05. After the initiative had finished robbery offences increased and stayed at a rate of around 6.0 per 1,000 for the next two financial years, however, there has now been a steady annual decline in robbery rates across London since 2006/07.
The increases in robbery were largely attributed to the rise in youth on youth robberies across London with particular focus around schools and transport interchanges and increased usage and ownership of items such as mobile phones, one of the most commonly stolen items. The increases that followed the end of the street crime initiative were thought somewhat to be a result of the increased mobility of young people when the introduction of oyster cards to provide under-16s free travel on London's transport network was introduced.[54]
Race and crime
In June 2010 The Sunday Telegraph, through a Freedom of Information Act request, obtained statistics on accusations of crime broken down by race from the Metropolitan Police Service.[n 2] The figures showed that the majority of males who were accused of violent crimes in 2009–10 were black. Of the recorded 18,091 such accusations against males, 54 percent accused of street crimes were black; for robbery, 59 percent; and for gun crimes, 67 percent. Between April 2005 and January 2006, figures from the Metropolitan Police Service showed that black people accounted for 46 percent of car-crime arrests generated by automatic number plate recognition cameras.[56]
Street crimes include muggings, assault with intent to rob, and snatching property. Black males accounted for 29 percent of the male victims of gun crime and 24 percent of the male victims of knife crime. Similar statistics were recorded for females. On knife crime, 45 percent of suspected female perpetrators were black; for gun crime, 58 percent; and for robberies, 52 percent.[55]
Operation Trident was set up in March 1998 by the Metropolitan Police to investigate gun crime in London's black community after black-on-black shootings in Lambeth and Brent.[57]
Bicycle thefts
In 2014, the number of bicycles reported stolen to the Metropolitan Police and City of London Police forces came to 17,809.[58] However the true number of bicycle thefts may be much larger as many victims do not report it to the police. According to the British Crime Survey and Transport for London only one in four victims of bicycle thefts actually report the crime.[59]
Metropolitan force comparisons
Below are crime rate comparisons for London and the metropolitan districts of England in 2007/08 financial year.[60][61]
| Police force | Main city | Homicides | Firearms offences | Violence against the person |
Sexual offences | Robbery | Burglary (residential) | Theft of and from motor vehicles |
| Greater London | London | 2.0 | 45.3 | 23.2 | 1.2 | 4.9 | 8.0 | 16.0 |
| Greater Manchester | Manchester | 1.9 | 44.6 | 19.3 | 1.2 | 2.9 | 8.3 | 16.7 |
| West Midlands | Birmingham | 1.6 | 37.5 | 20.5 | 1.2 | 2.9 | 6.9 | 13.1 |
| Merseyside | Liverpool | 2.3 | 29.5 | 15.4 | 0.7 | 1.2 | 6.2 | 10.7 |
| South Yorkshire | Sheffield | 2.1 | 15.0 | 18.1 | 0.9 | 1.0 | 6.6 | 15.4 |
| West Yorkshire | Leeds | 2.1 | 15.1 | 17.7 | 1.0 | 1.4 | 8.5 | 13.2 |
| Northumbria Police (Tyne and Wear) | Newcastle | 2.1 | 5.6 | 13.9 | 0.8 | 0.6 | 3.6 | 8.1 |
| England | London | 1.4 | 18.9 | 17.5 | 1.0 | 1.6 | 5.2 | 11.1 |
Footnotes
- [10][11][12][13][14][15][16][17][18][19][20][21]
- The figures relate to those 'proceeded against', including those prosecuted in court, whether convicted or acquitted; those issued with a caution, warning or penalty notice; those the Crown Prosecution Service decided not to charge; and those whose crimes were 'taken into consideration' after a further offence.[55]
References
- Clark, D. "Crime rate per 1,000 population in London from 2010/11 to 2019/20". Statista. Retrieved 7 February 2021.
- "Boris Johnson blames Sadiq Khan for London knife crime 'scandal'". BBC News. BBC News. 23 July 2018. Retrieved 7 February 2021.
- France, Anthony (17 July 2020). "London crime rising five times faster than rest of England, report reveals". Evening Standard. Retrieved 7 February 2021.
- "Boris Johnson blames Sadiq Khan for London knife crime 'scandal'". BBC News. BBC News. 23 July 2018. Retrieved 7 February 2021.
- Lies, Damned Lies, And Statistics: Why London’s Murder Rate Is Not Higher Than NYC’s https://www.bellingcat.com/news/uk-and-europe/2019/03/20/lies-damned-lies-and-statistics-why-londons-murder-rate-is-not-higher-than-nycs/
- "FactCheck: Is London really deadlier than New York?". Channel 4 News. Retrieved 17 April 2018.
- "Fifty hate crimes daily in London as racist, homophobic and disability abuse rockets". East London and West Essex Guardian Series. Retrieved 30 September 2019.
- "London knife crime: Can Chicago's model cure the violence?". BBC. 21 September 2018. Retrieved 2 November 2018.
- "HOSB Issue 04/00 22 February 2000 International comparisons of criminal justice statistics 1998" (PDF). Archived from the original (PDF) on 7 December 2009. Retrieved 13 December 2011.
- "Performance Information 2007 Annual \(Calendar Year\) Crime Stats" (PDF). Archived from the original (PDF) on 8 June 2011. Retrieved 13 December 2011.
- "MPS Crime Mapping Data Tables". Maps.met.police.uk. Archived from the original on 18 April 2009. Retrieved 13 December 2011.
- "MPS Borough Level Crime Figures 2000/01". Archived from the original on 24 March 2012. Retrieved 13 December 2011.
- "MPS Borough Level Crime Figures 2001/02". Archived from the original on 24 March 2012. Retrieved 13 December 2011.
- "MPS Borough Level Crime Figures 2002/03". Archived from the original on 24 March 2012. Retrieved 13 December 2011.
- "MPS Borough Level Crime Figures 2003/04". Archived from the original on 24 March 2012. Retrieved 13 December 2011.
- "MPS Borough Level Crime Figures 2004/05". Archived from the original on 24 March 2012. Retrieved 13 December 2011.
- "MPS Borough Level Crime Figures 2005/06". Archived from the original on 24 March 2012. Retrieved 13 January 2012.
- "MPS Borough Level Crime Figures 2006/07". Archived from the original on 24 March 2012. Retrieved 13 January 2012.
- "MPS Borough Level Crime Figures 2007/08". Archived from the original on 24 March 2012. Retrieved 13 January 2012.
- "MPS Borough Level Crime Figures 2008/09". Archived from the original on 24 March 2012. Retrieved 13 January 2012.
- "Crime in England and Wales: Police Force Area Data Tables – Office for National Statistics". Government of the United Kingdom. Retrieved 4 January 2018.
- "London killings: All the victims of 2018". BBC. Retrieved 7 February 2019.
- "2019 ends with 143 London killings amid murder probe into fight death". London Evening Standard. 2 January 2020. Retrieved 4 January 2020.
- Kane, Hannah (2 January 2020). "Murder investigation launched as man found critically injured in Surbiton park". getwestlondon. Retrieved 4 January 2020.
- "Number of homicides in London climbs to 10-year high". The Guardian. Retrieved 1 January 2020.
- "Crime data dashboard | The Met". www.met.police.uk. Retrieved 13 April 2019.
- "Number of homicides in London climbs to 10-year high". The Guardian. Retrieved 1 January 2020.
- "Estimates of the population for the UK, England and Wales, Scotland and Northern Ireland – Office for National Statistics". Government of the United Kingdom. Retrieved 27 January 2020.
- Beswick, Emma (6 April 2018). "How bad is London's murder rate compared to other EU capitals?". euronews. Retrieved 27 January 2020.
- http://www.itv.com/news/london/2016-01-24/london-murder-rate-up-14-over-the-past-year/
- "Moped Crime".
- "Crime in England and Wales 2008/09" (PDF). Archived from the original (PDF) on 12 December 2009. Retrieved 13 January 2012.
- "MPS Monthly Crime Totals". Archived from the original on 24 March 2012. Retrieved 13 January 2012.
- "Home Office: Crime in England and Wales 2008/09, p.30" (PDF). Archived from the original (PDF) on 12 December 2009. Retrieved 13 January 2012.
- "Home Office: Crime in England and Wales 2008/09, p/30" (PDF). Archived from the original (PDF) on 12 December 2009. Retrieved 13 January 2012.
- "Home Office: Crime in England and Wales 2008/09, p. 28" (PDF). Archived from the original (PDF) on 12 December 2009. Retrieved 13 January 2012.
- "London gun crime figures 'worryingly high' – Channel 4 News". Channel 4. 30 March 2011. Retrieved 8 June 2013.
- "Interactive Crime Figures accessed 10.01.10". Met.police.uk. Retrieved 13 January 2012.
- Crime Summary 2007 Archived 8 June 2011 at the Wayback Machine
- Crime Summary 2007, p.2 Archived 8 June 2011 at the Wayback Machine
- "MPS Monthly Knife Crime Summary, November 2009" (PDF). Retrieved 13 January 2012.
- "Tackling Knife Crime: Operation Blunt". Archived from the original on 22 October 2008. Retrieved 10 January 2010.
- Metropolitan Police. "More than 500 knives seized in Blunt 2". Cms.met.police.uk. Retrieved 13 January 2012.
- "Hate crime or special crime dashboard | The Met". www.met.police.uk. Retrieved 11 March 2019.
- Desk, Mirror News (14 February 2019). "GPS Devices to Track Knife Crime Offenders in London". The Mirror Herald. Retrieved 25 March 2019.
- "Home Office Counting Rules: Robbery" (PDF). Archived from the original (PDF) on 12 December 2009. Retrieved 13 January 2012.
- "Metropolitan Police Crime Data Tables (2000–01 to 2008–09 data". Maps.met.police.uk. Archived from the original on 18 April 2009. Retrieved 13 January 2012.
- "Notifiable Offences, England & Wales 1996" (PDF). Archived from the original (PDF) on 12 December 2009. Retrieved 13 January 2012.
- "Notifiable Offences, England & Wales 1997" (PDF). Archived from the original (PDF) on 12 December 2009. Retrieved 13 January 2012.
- "Recorded Crime in England & Wales 1998–99" (PDF). Archived from the original (PDF) on 12 December 2009. Retrieved 13 January 2012.
- "BBC Street Crime Surges 18.01.00". BBC News. 18 January 2000. Retrieved 13 January 2012.
- "Home Office: Tackling Robbery, practical lessons from the street crime initiative". Government of the United Kingdom. Retrieved 13 January 2012.
- "Government Office for London: Personal Robbery Project 2007" (PDF). Government of the United Kingdom. Retrieved 13 January 2012.
- Alderson, Andrew. "Violent inner-city crime, the figures, and a question of race". The Daily Telegraph. 26 June 2010. Retrieved 23 September 2010.
- Gadher, Dipesh. "Cameras set racial poser on car crime". The Times. 14 May 2006. Retrieved 27 September 2010.
- "Q&A: Operation Trident". BBC News. 14 September 2006. Retrieved 26 September 2010.
- "The State of Bike Thefts in London, UK in 2014". Litelok.com. 10 June 2015. Retrieved 18 June 2015.
- "Transport for London – Cycle Security Plan" (PDF). Retrieved 18 June 2015.
- "Home Office Homicide, Firearms Offences and Intimate Violence 2007/08" (PDF). Archived from the original (PDF) on 15 February 2010. Retrieved 13 January 2012.
- "Home Office: Crime in England & Wales 2007/08" (PDF). Archived from the original (PDF) on 12 December 2009. Retrieved 13 January 2012.
Further information
External links
- www.crime-statistics.co.uk UK / London Crime Statistics and Crime Statistic Comparisons
- Government Office for London Data & Analytical Tools
- Give Life Domestic Violence Project
- Home Office Anti-Social Behaviour Action Website
- Home Office Crime Reduction Website
- Home Office Statistical Publications Archive
- Knife City – Carrying a knife. Its not a game
- London Against Gun and Knife Crime
- London Serious Youth Violence Board
- Metropolitan Police Operation Bumblebee Burglary Prevention Scheme
- Metropolitan Police Publication Scheme
- National Policing Improvement Agency Local Crime Mapping
- Operation Trident: Stop the Guns
- Youth Offending Service Statistics