Dehiwala Polling Division
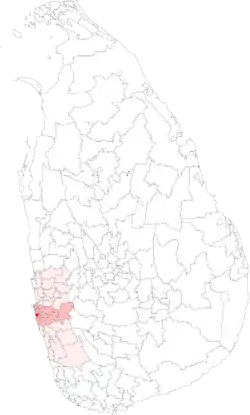
The Dehiwala Polling Division is a Polling Division in the Colombo Electoral District, in the Western Province, Sri Lanka.
Dehiwala | |
|---|---|
 | |
| Coordinates: 6.858329°N 79.876676°E | |
| Country | Sri Lanka |
| Province | Western Province, Sri Lanka |
| Electoral District | Colombo Electoral District |
| Area | |
| • Total | 9.18 km2 (3.54 sq mi) |
| Population (2012)[1] | |
| • Total | 88,962 |
| • Density | 9,691/km2 (25,100/sq mi) |
| ISO 3166 code | EC-01F |
Presidential Election Results
Summary
The winner of Dehiwala has matched the final country result 4 out of 8 times.
| Year | Dehiwala | Colombo Electoral District | MAE[2] % | Sri Lanka | MAE[3] % | |||
|---|---|---|---|---|---|---|---|---|
| 2019 | NDF | SLPP | 11.71% | SLPP | 10.77% | |||
| 2015 | NDF | NDF | 9.60% | NDF | 13.92% | |||
| 2010 | NDF | UPFA | 9.02% | UPFA | 14.12% | |||
| 2005 | UNP | UNP | 6.09% | UPFA | 8.54% | |||
| 1999 | UNP | PA | 2.93% | PA | 4.49% | |||
| 1994 | PA | PA | 0.73% | PA | 1.72% | |||
| 1988 | UNP | UNP | 0.86% | UNP | 0.37% | |||
| 1982 | UNP | UNP | 2.66% | UNP | 6.31% | |||
| Matches/Mean MAE | 4/8 | 7/8 | 5.45% | 8/8 | 7.53% | |||
2019 Sri Lankan Presidential Election
| Party | Dehiwala[4] | Colombo Electoral District | Sri Lanka | |||||||
|---|---|---|---|---|---|---|---|---|---|---|
| Votes | % | Votes | % | Votes | % | |||||
| NDF | 25,004 | 53.74% | 559,921 | 40.92% | 5,564,239 | 41.99% | ||||
| SLPP | 19,122 | 41.10% | 727,713 | 53.19% | 6,924,255 | 52.25% | ||||
| NMPP | 1,480 | 3.18% | 53,803 | 3.93% | 418,553 | 3.16% | ||||
| Other Parties (with < 1%) | 919 | 1.98% | 26,740 | 1.95% | 345,452 | 2.61% | ||||
| Valid Votes | 46,525 | 98.78% | 1,368,177 | 98.89% | 13,252,499 | 98.99% | ||||
| Rejected Votes | 576 | 1.22% | 15,333 | 1.11% | 135,452 | 1.01% | ||||
| Total Polled | 47,101 | 79.98% | 1,383,510 | 82.82% | 13,387,951 | 83.71% | ||||
| Registered Electors | 58,892 | 1,670,403 | 15,992,568 | |||||||
2015 Sri Lankan Presidential Election
| Party | Dehiwala[5] | Colombo Electoral District | Sri Lanka | |||||||
|---|---|---|---|---|---|---|---|---|---|---|
| Votes | % | Votes | % | Votes | % | |||||
| NDF | 30,955 | 65.63% | 725,073 | 55.93% | 6,217,162 | 51.28% | ||||
| UPFA | 15,932 | 33.78% | 562,614 | 43.40% | 5,768,090 | 47.58% | ||||
| Other Parties (with < 1%) | 282 | 0.60% | 8,673 | 0.67% | 138,200 | 1.14% | ||||
| Valid Votes | 47,169 | 98.75% | 1,296,360 | 98.83% | 12,123,452 | 98.85% | ||||
| Rejected Votes | 599 | 1.25% | 15,334 | 1.17% | 140,925 | 1.15% | ||||
| Total Polled | 47,768 | 79.86% | 1,311,694 | 81.34% | 12,264,377 | 78.69% | ||||
| Registered Electors | 59,812 | 1,612,660 | 15,585,942 | |||||||
2010 Sri Lankan Presidential Election
| Party | Dehiwala[6] | Colombo Electoral District | Sri Lanka | |||||||
|---|---|---|---|---|---|---|---|---|---|---|
| Votes | % | Votes | % | Votes | % | |||||
| NDF | 24,441 | 55.07% | 533,022 | 45.90% | 4,173,185 | 40.15% | ||||
| UPFA | 19,457 | 43.84% | 614,740 | 52.93% | 6,015,934 | 57.88% | ||||
| Other Parties (with < 1%) | 485 | 1.09% | 13,620 | 1.17% | 204,494 | 1.97% | ||||
| Valid Votes | 44,383 | 98.96% | 1,161,382 | 99.03% | 10,393,613 | 99.03% | ||||
| Rejected Votes | 465 | 1.04% | 11,394 | 0.97% | 101,838 | 0.97% | ||||
| Total Polled | 44,848 | 73.29% | 1,172,776 | 76.09% | 10,495,451 | 66.70% | ||||
| Registered Electors | 61,194 | 1,541,242 | 15,734,587 | |||||||
2005 Sri Lankan Presidential Election
| Party | Dehiwala[7] | Colombo Electoral District | Sri Lanka | |||||||
|---|---|---|---|---|---|---|---|---|---|---|
| Votes | % | Votes | % | Votes | % | |||||
| UNP | 24,660 | 57.25% | 569,627 | 51.12% | 4,706,366 | 48.43% | ||||
| UPFA | 18,005 | 41.80% | 534,431 | 47.96% | 4,887,152 | 50.29% | ||||
| Other Parties (with < 1%) | 412 | 0.96% | 10,192 | 0.91% | 123,521 | 1.27% | ||||
| Valid Votes | 43,077 | 99.15% | 1,114,250 | 98.86% | 9,717,039 | 98.88% | ||||
| Rejected Votes | 369 | 0.85% | 12,879 | 1.14% | 109,869 | 1.12% | ||||
| Total Polled | 43,446 | 73.98% | 1,127,129 | 75.85% | 9,826,908 | 69.51% | ||||
| Registered Electors | 58,728 | 1,486,021 | 14,136,979 | |||||||
1999 Sri Lankan Presidential Election
| Party | Dehiwala[8] | Colombo Electoral District | Sri Lanka | |||||||
|---|---|---|---|---|---|---|---|---|---|---|
| Votes | % | Votes | % | Votes | % | |||||
| UNP | 19,126 | 47.58% | 425,185 | 44.08% | 3,602,748 | 42.71% | ||||
| PA | 18,683 | 46.48% | 474,310 | 49.18% | 4,312,157 | 51.12% | ||||
| JVP | 1,346 | 3.35% | 44,009 | 4.56% | 343,927 | 4.08% | ||||
| Other Parties (with < 1%) | 627 | 1.56% | 12,821 | 1.33% | 140,825 | 1.67% | ||||
| SMBP | 412 | 1.03% | 8,209 | 0.85% | 35,854 | 0.43% | ||||
| Valid Votes | 40,194 | 96.53% | 964,534 | 97.06% | 8,435,754 | 97.69% | ||||
| Rejected Votes | 1,446 | 3.47% | 29,197 | 2.94% | 199,536 | 2.31% | ||||
| Total Polled | 41,640 | 71.29% | 993,731 | 73.39% | 8,635,290 | 72.17% | ||||
| Registered Electors | 58,407 | 1,354,025 | 11,965,536 | |||||||
1994 Sri Lankan Presidential Election
| Party | Dehiwala[9] | Colombo Electoral District | Sri Lanka | |||||||
|---|---|---|---|---|---|---|---|---|---|---|
| Votes | % | Votes | % | Votes | % | |||||
| PA | 23,977 | 63.99% | 557,708 | 64.82% | 4,709,205 | 62.28% | ||||
| UNP | 12,783 | 34.12% | 288,741 | 33.56% | 2,715,283 | 35.91% | ||||
| Other Parties (with < 1%) | 710 | 1.89% | 13,937 | 1.62% | 137,040 | 1.81% | ||||
| Valid Votes | 37,470 | 98.39% | 860,386 | 98.17% | 7,561,526 | 98.03% | ||||
| Rejected Votes | 614 | 1.61% | 16,060 | 1.83% | 151,706 | 1.97% | ||||
| Total Polled | 38,084 | 68.87% | 876,446 | 69.59% | 7,713,232 | 69.12% | ||||
| Registered Electors | 55,301 | 1,259,484 | 11,158,880 | |||||||
1988 Sri Lankan Presidential Election
| Party | Dehiwala[10] | Colombo Electoral District | Sri Lanka | |||||||
|---|---|---|---|---|---|---|---|---|---|---|
| Votes | % | Votes | % | Votes | % | |||||
| UNP | 18,326 | 50.03% | 361,337 | 49.14% | 2,569,199 | 50.43% | ||||
| SLFP | 16,599 | 45.31% | 339,958 | 46.23% | 2,289,857 | 44.95% | ||||
| SLMP | 1,707 | 4.66% | 34,020 | 4.63% | 235,701 | 4.63% | ||||
| Valid Votes | 36,632 | 98.60% | 735,315 | 98.49% | 5,094,754 | 98.24% | ||||
| Rejected Votes | 520 | 1.40% | 11,295 | 1.51% | 91,499 | 1.76% | ||||
| Total Polled | 37,152 | 70.14% | 746,610 | 67.53% | 5,186,256 | 55.87% | ||||
| Registered Electors | 52,969 | 1,105,583 | 9,283,143 | |||||||
1982 Sri Lankan Presidential Election
| Party | Dehiwala[11] | Colombo Electoral District | Sri Lanka | |||||||
|---|---|---|---|---|---|---|---|---|---|---|
| Votes | % | Votes | % | Votes | % | |||||
| UNP | 23,730 | 60.73% | 436,290 | 57.86% | 3,450,815 | 52.93% | ||||
| SLFP | 13,194 | 33.76% | 274,476 | 36.40% | 2,546,348 | 39.05% | ||||
| JVP | 1,139 | 2.91% | 28,580 | 3.79% | 273,428 | 4.19% | ||||
| LSSP | 695 | 1.78% | 9,655 | 1.28% | 58,531 | 0.90% | ||||
| Other Parties (with < 1%) | 318 | 0.81% | 5,030 | 0.67% | 190,929 | 2.93% | ||||
| Valid Votes | 39,076 | 98.97% | 754,031 | 98.95% | 6,520,156 | 98.78% | ||||
| Rejected Votes | 406 | 1.03% | 7,990 | 1.05% | 80,470 | 1.22% | ||||
| Total Polled | 39,482 | 76.48% | 762,021 | 76.88% | 6,600,626 | 80.15% | ||||
| Registered Electors | 51,622 | 991,194 | 8,235,358 | |||||||
Parliamentary Election Results
Summary
The winner of Dehiwala has matched the final country result 4 out of 7 times. Hence, Dehiwala is a Weak Bellwether for Parliamentary Elections.
| Year | Dehiwala | Colombo Electoral District | MAE[12] % | Sri Lanka | MAE[13] % | |||
|---|---|---|---|---|---|---|---|---|
| 2015 | UNP | UNP | 9.33% | UNP | 13.50% | |||
| 2010 | UNP | UPFA | 7.03% | UPFA | 15.10% | |||
| 2004 | UNP | UNP | 6.63% | UPFA | 11.76% | |||
| 2001 | UNP | UNP | 3.78% | UNP | 7.63% | |||
| 2000 | UNP | UNP | 3.50% | PA | 7.79% | |||
| 1994 | PA | PA | 0.73% | PA | 2.33% | |||
| 1989 | UNP | UNP | 3.98% | UNP | 2.90% | |||
| Matches/Mean MAE | 4/7 | 5/7 | 5.00% | 7/7 | 8.71% | |||
2015 Sri Lankan Parliamentary Election
| Party | Dehiwala[14] | Colombo Electoral District | Sri Lanka | |||||||
|---|---|---|---|---|---|---|---|---|---|---|
| Votes | % | Votes | % | Votes | % | |||||
| UNP | 28,153 | 63.62% | 640,743 | 53.04% | 5,098,916 | 45.77% | ||||
| UPFA | 13,273 | 29.99% | 474,063 | 39.25% | 4,732,664 | 42.48% | ||||
| JVP | 2,366 | 5.35% | 81,391 | 6.74% | 544,154 | 4.88% | ||||
| Other Parties (with < 1%) | 462 | 1.04% | 11,752 | 0.97% | 93,045 | 0.84% | ||||
| Valid Votes | 44,254 | 97.01% | 1,207,949 | 96.46% | 11,140,333 | 95.35% | ||||
| Rejected Votes | 1,330 | 2.92% | 43,372 | 3.46% | 516,926 | 4.42% | ||||
| Total Polled | 45,619 | 76.27% | 1,252,271 | 78.93% | 11,684,111 | 77.66% | ||||
| Registered Electors | 59,812 | 1,586,598 | 15,044,490 | |||||||
2010 Sri Lankan Parliamentary Election
| Party | Dehiwala[15] | Colombo Electoral District | Sri Lanka | |||||||
|---|---|---|---|---|---|---|---|---|---|---|
| Votes | % | Votes | % | Votes | % | |||||
| UNP | 15,831 | 44.15% | 339,750 | 36.19% | 2,357,057 | 29.37% | ||||
| UPFA | 15,472 | 43.15% | 480,896 | 51.23% | 4,846,388 | 60.38% | ||||
| DNA | 4,256 | 11.87% | 110,683 | 11.79% | 441,251 | 5.50% | ||||
| Other Parties (with < 1%) | 296 | 0.83% | 7,294 | 0.78% | 48,242 | 0.60% | ||||
| Valid Votes | 35,855 | 95.68% | 938,723 | 94.85% | 8,026,322 | 96.03% | ||||
| Rejected Votes | 1,606 | 4.29% | 50,354 | 5.09% | 581,465 | 6.96% | ||||
| Total Polled | 37,474 | 61.24% | 989,729 | 64.17% | 8,358,246 | 59.29% | ||||
| Registered Electors | 61,194 | 1,542,457 | 14,097,690 | |||||||
2004 Sri Lankan Parliamentary Election
| Party | Dehiwala[16] | Colombo Electoral District | Sri Lanka | |||||||
|---|---|---|---|---|---|---|---|---|---|---|
| Votes | % | Votes | % | Votes | % | |||||
| UNP | 19,865 | 47.20% | 441,841 | 41.77% | 3,486,792 | 37.73% | ||||
| UPFA | 12,577 | 29.88% | 414,688 | 39.20% | 4,223,126 | 45.70% | ||||
| JHU | 9,247 | 21.97% | 190,618 | 18.02% | 552,723 | 5.98% | ||||
| Other Parties (with < 1%) | 396 | 0.94% | 10,713 | 1.01% | 90,868 | 0.98% | ||||
| Valid Votes | 42,085 | 97.28% | 1,057,860 | 96.47% | 9,241,931 | 94.52% | ||||
| Rejected Votes | 1,173 | 2.71% | 38,605 | 3.52% | 534,452 | 5.47% | ||||
| Total Polled | 43,260 | 71.91% | 1,096,571 | 74.71% | 9,777,821 | 75.74% | ||||
| Registered Electors | 60,159 | 1,467,751 | 12,909,631 | |||||||
2001 Sri Lankan Parliamentary Election
| Party | Dehiwala[17] | Colombo Electoral District | Sri Lanka | |||||||
|---|---|---|---|---|---|---|---|---|---|---|
| Votes | % | Votes | % | Votes | % | |||||
| UNP | 24,219 | 55.60% | 546,417 | 51.62% | 4,086,026 | 45.62% | ||||
| PA | 12,686 | 29.13% | 353,401 | 33.39% | 3,330,815 | 37.19% | ||||
| JVP | 3,786 | 8.69% | 117,404 | 11.09% | 815,353 | 9.10% | ||||
| TULF | 1,434 | 3.29% | 12,696 | 1.20% | 348,164 | 3.89% | ||||
| SU | 944 | 2.17% | 16,970 | 1.60% | 50,665 | 0.57% | ||||
| Other Parties (with < 1%) | 487 | 1.12% | 11,593 | 1.10% | 162,452 | 1.81% | ||||
| Valid Votes | 43,556 | 96.78% | 1,058,481 | 96.28% | 8,955,844 | 94.77% | ||||
| Rejected Votes | 1,448 | 3.22% | 40,901 | 3.72% | 494,009 | 5.23% | ||||
| Total Polled | 45,004 | 73.51% | 1,099,382 | 76.31% | 9,449,878 | 76.03% | ||||
| Registered Electors | 61,222 | 1,440,682 | 12,428,762 | |||||||
2000 Sri Lankan Parliamentary Election
| Party | Dehiwala[18] | Colombo Electoral District | Sri Lanka | |||||||
|---|---|---|---|---|---|---|---|---|---|---|
| Votes | % | Votes | % | Votes | % | |||||
| UNP | 19,646 | 46.65% | 440,684 | 43.45% | 3,451,765 | 40.12% | ||||
| PA | 14,382 | 34.15% | 394,146 | 38.86% | 3,899,329 | 45.33% | ||||
| SU | 3,200 | 7.60% | 49,671 | 4.90% | 127,859 | 1.49% | ||||
| JVP | 2,556 | 6.07% | 78,133 | 7.70% | 518,725 | 6.03% | ||||
| NUA | 977 | 2.32% | 27,067 | 2.67% | 185,593 | 2.16% | ||||
| Other Parties (with < 1%) | 728 | 1.73% | 19,281 | 1.90% | 162,201 | 1.89% | ||||
| ACTC | 622 | 1.48% | 5,238 | 0.52% | 27,289 | 0.32% | ||||
| Valid Votes | 42,111 | N/A | 1,014,220 | N/A | 8,602,617 | N/A | ||||
1994 Sri Lankan Parliamentary Election
| Party | Dehiwala[19] | Colombo Electoral District | Sri Lanka | |||||||
|---|---|---|---|---|---|---|---|---|---|---|
| Votes | % | Votes | % | Votes | % | |||||
| PA | 20,882 | 51.90% | 469,642 | 50.94% | 3,887,805 | 48.94% | ||||
| UNP | 16,942 | 42.11% | 385,100 | 41.77% | 3,498,370 | 44.04% | ||||
| MEP | 1,145 | 2.85% | 42,734 | 4.64% | 68,538 | 0.86% | ||||
| IND1 | 813 | 2.02% | 9,251 | 1.00% | 48,199 | 0.61% | ||||
| Other Parties (with < 1%) | 453 | 1.13% | 15,206 | 1.65% | 93,874 | 1.18% | ||||
| Valid Votes | 40,235 | 96.93% | 921,933 | 96.18% | 7,943,688 | 95.20% | ||||
| Rejected Votes | 1,273 | 3.07% | 36,635 | 3.82% | 400,395 | 4.80% | ||||
| Total Polled | 41,508 | 75.06% | 958,568 | 76.04% | 8,344,095 | 74.75% | ||||
| Registered Electors | 55,301 | 1,260,686 | 11,163,064 | |||||||
1989 Sri Lankan Parliamentary Election
| Party | Dehiwala[20] | Colombo Electoral District | Sri Lanka | |||||||
|---|---|---|---|---|---|---|---|---|---|---|
| Votes | % | Votes | % | Votes | % | |||||
| UNP | 19,768 | 54.91% | 374,530 | 51.67% | 2,838,005 | 50.71% | ||||
| SLFP | 12,193 | 33.87% | 205,053 | 28.29% | 1,785,369 | 31.90% | ||||
| MEP | 1,724 | 4.79% | 76,966 | 10.62% | 90,480 | 1.62% | ||||
| USA | 1,341 | 3.73% | 31,873 | 4.40% | 141,983 | 2.54% | ||||
| SLMC | 790 | 2.19% | 29,308 | 4.04% | 202,016 | 3.61% | ||||
| Other Parties (with < 1%) | 184 | 0.51% | 7,112 | 0.98% | 67,723 | 1.21% | ||||
| Valid Votes | 36,000 | 96.38% | 724,842 | 95.36% | 5,596,468 | 93.87% | ||||
| Rejected Votes | 1,351 | 3.62% | 35,271 | 4.64% | 365,563 | 6.13% | ||||
| Total Polled | 37,351 | 71.59% | 760,113 | 69.87% | 5,962,031 | 63.60% | ||||
| Registered Electors | 52,176 | 1,087,891 | 9,374,164 | |||||||
Demographics
Ethnicity
The Dehiwala Polling Division has a Sinhalese majority (60.5%), a significant Moor population (20.8%) and a significant Sri Lankan Tamil population (14.5%) . In comparison, the Colombo Electoral District (which contains the Dehiwala Polling Division) has a Sinhalese majority (76.5%), a significant Moor population (10.7%) and a significant Sri Lankan Tamil population (10.1%) [1]
Ethnicity in Dehiwala[1]
Religion
The Dehiwala Polling Division has a Buddhist majority (54.3%), a significant Muslim population (22.6%) and a significant Hindu population (12.1%) . In comparison, the Colombo Electoral District (which contains the Dehiwala Polling Division) has a Buddhist majority (70.2%) and a significant Muslim population (11.8%) [1]
Religion in Dehiwala[1]
References
- "Census of Population and Housing 2012". statistics.gov.lk. Department of Census and Statistics, Sri Lanka. 2012.
- The mean absolute error, between the percentages of votes each party got in Dehiwala and the Colombo Electoral District. It is a measure of the difference in voting behaviour between the two regions.
- The mean absolute error, between the percentages of votes each party got in Dehiwala and the country. It is a measure of the difference in voting behaviour between the two regions.
- "2019 Sri Lankan presidential election Results". elections.gov.lk. Election Commission of Sri Lanka. 2019.
- "2015 Sri Lankan presidential election Results". elections.gov.lk. Election Commission of Sri Lanka. 2015.
- "2010 Sri Lankan presidential election Results". elections.gov.lk. Election Commission of Sri Lanka. 2010.
- "2005 Sri Lankan presidential election Results". elections.gov.lk. Election Commission of Sri Lanka. 2005.
- "1999 Sri Lankan presidential election Results". elections.gov.lk. Election Commission of Sri Lanka. 1999.
- "1994 Sri Lankan presidential election Results". elections.gov.lk. Election Commission of Sri Lanka. 1994.
- "1988 Sri Lankan presidential election Results". elections.gov.lk. Election Commission of Sri Lanka. 1988.
- "1982 Sri Lankan presidential election Results". elections.gov.lk. Election Commission of Sri Lanka. 1982.
- The mean absolute error, between the percentages of votes each party got in Dehiwala and the Colombo Electoral District. It is a measure of the difference in voting behaviour between the two regions.
- The mean absolute error, between the percentages of votes each party got in Dehiwala and the country. It is a measure of the difference in voting behaviour between the two regions.
- "2015 Sri Lankan parliamentary election Results" (PDF). elections.gov.lk. Election Commission of Sri Lanka. 2015.
- "2010 Sri Lankan parliamentary election Results" (PDF). elections.gov.lk. Election Commission of Sri Lanka. 2010.
- "2004 Sri Lankan parliamentary election Results" (PDF). elections.gov.lk. Election Commission of Sri Lanka. 2004.
- "2001 Sri Lankan parliamentary election Results" (PDF). elections.gov.lk. Election Commission of Sri Lanka. 2001.
- "2000 Sri Lankan parliamentary election Results" (PDF). elections.gov.lk. Election Commission of Sri Lanka. 2000.
- "1994 Sri Lankan parliamentary election Results" (PDF). elections.gov.lk. Election Commission of Sri Lanka. 1994.
- "1989 Sri Lankan parliamentary election Results" (PDF). elections.gov.lk. Election Commission of Sri Lanka. 1989.