Demographic history of Romania
This article presents the demographic history of Romania through census results. See Demographics of Romania for a more detailed overview of the country's present-day demographics.
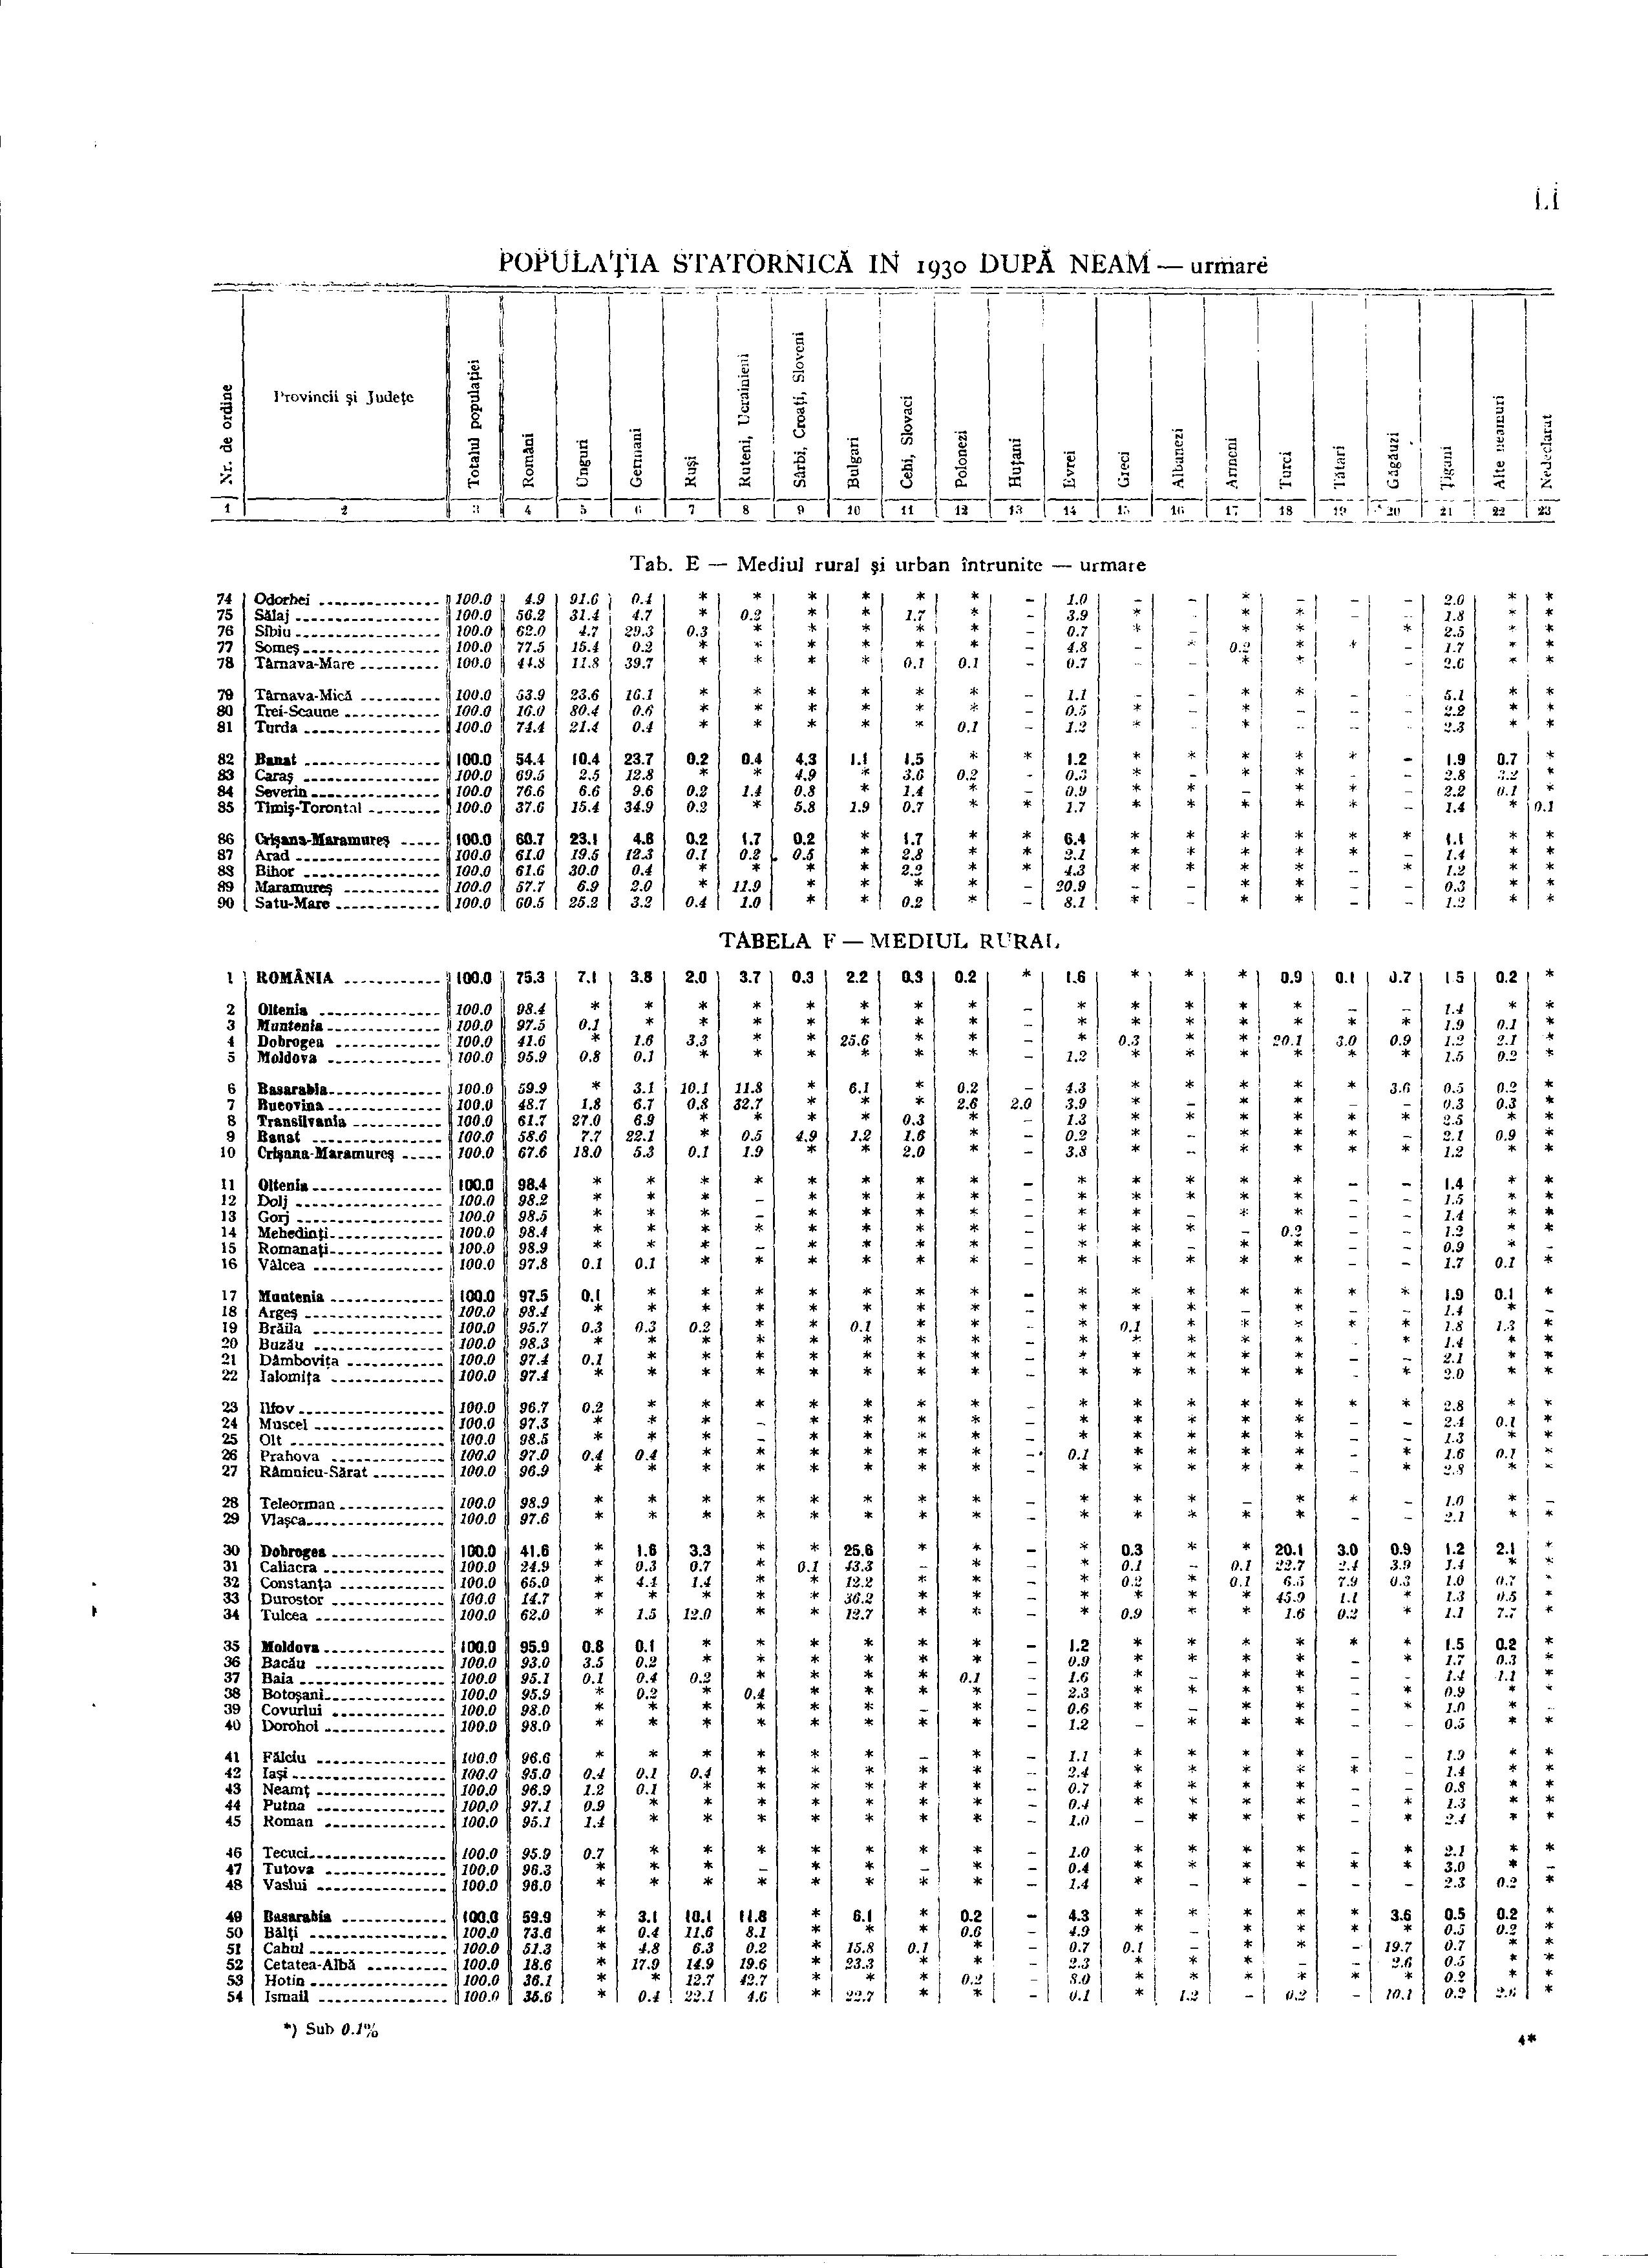
The 1930 census was the only one to cover Greater Romania. Censuses in 1948, 1956, 1966, 1977, 1992, 2002, and 2011 covered Romania's present-day territory.[1] All but the 1948 census, which asked about mother tongue, had a question on ethnicity. Moldavia and Wallachia each held a census in 1859. The Romanian Old Kingdom conducted statistical estimates in 1884, 1889, and 1894, and held censuses in 1899 and 1912. Ion Antonescu's regime also held two: a general one in April 1941, and one for those with "Jewish blood" in May, 1942.
1860 census
| Religion | number | % |
|---|---|---|
| Romanian Orthodox | 4,198,862 | 94.89 |
| Jewish | 134,168 | 3.03 |
| Roman Catholic | 45,152 | 1.02 |
| Protestant | 28,903 | 0.65 |
| Lipovans | 8,375 | 0.19 |
| Armenians | 8,178 | 0.18 |
| Muslim | 1,323 | 0.03 |
| Total[2][3] | 4,424,961 | 100.0 |
1887 estimate
| Ethnicity | number | % |
|---|---|---|
| Romanians | 4,500,000 | 81.8 |
| Jews | 300,000 | 5.5 |
| Romani | 200,000 | 3.6 |
| Bulgarians | 100,000 | 1.8 |
| Germans | 50,000 | 0.9 |
| Hungarians | 50,000 | 0.9 |
| Armenians | 15,000 | 0.3 |
| Others* | 285,000 | 5.2 |
| Total[4] | 5,500,000 | 100.0 |
December 1899 census
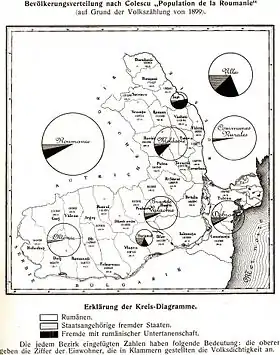
| Ethnicity | number | % |
|---|---|---|
| Romanians | 5,489,296 | 92.2 |
| Jews | 256,588 | 4.3 |
| Others | 210,806 | 3.5 |
| Total[5] | 5,956,690 | 100.0 |
19 December 1912 census
| number | % | |
|---|---|---|
| Total[6] | 7,234,919 | 100.0 |
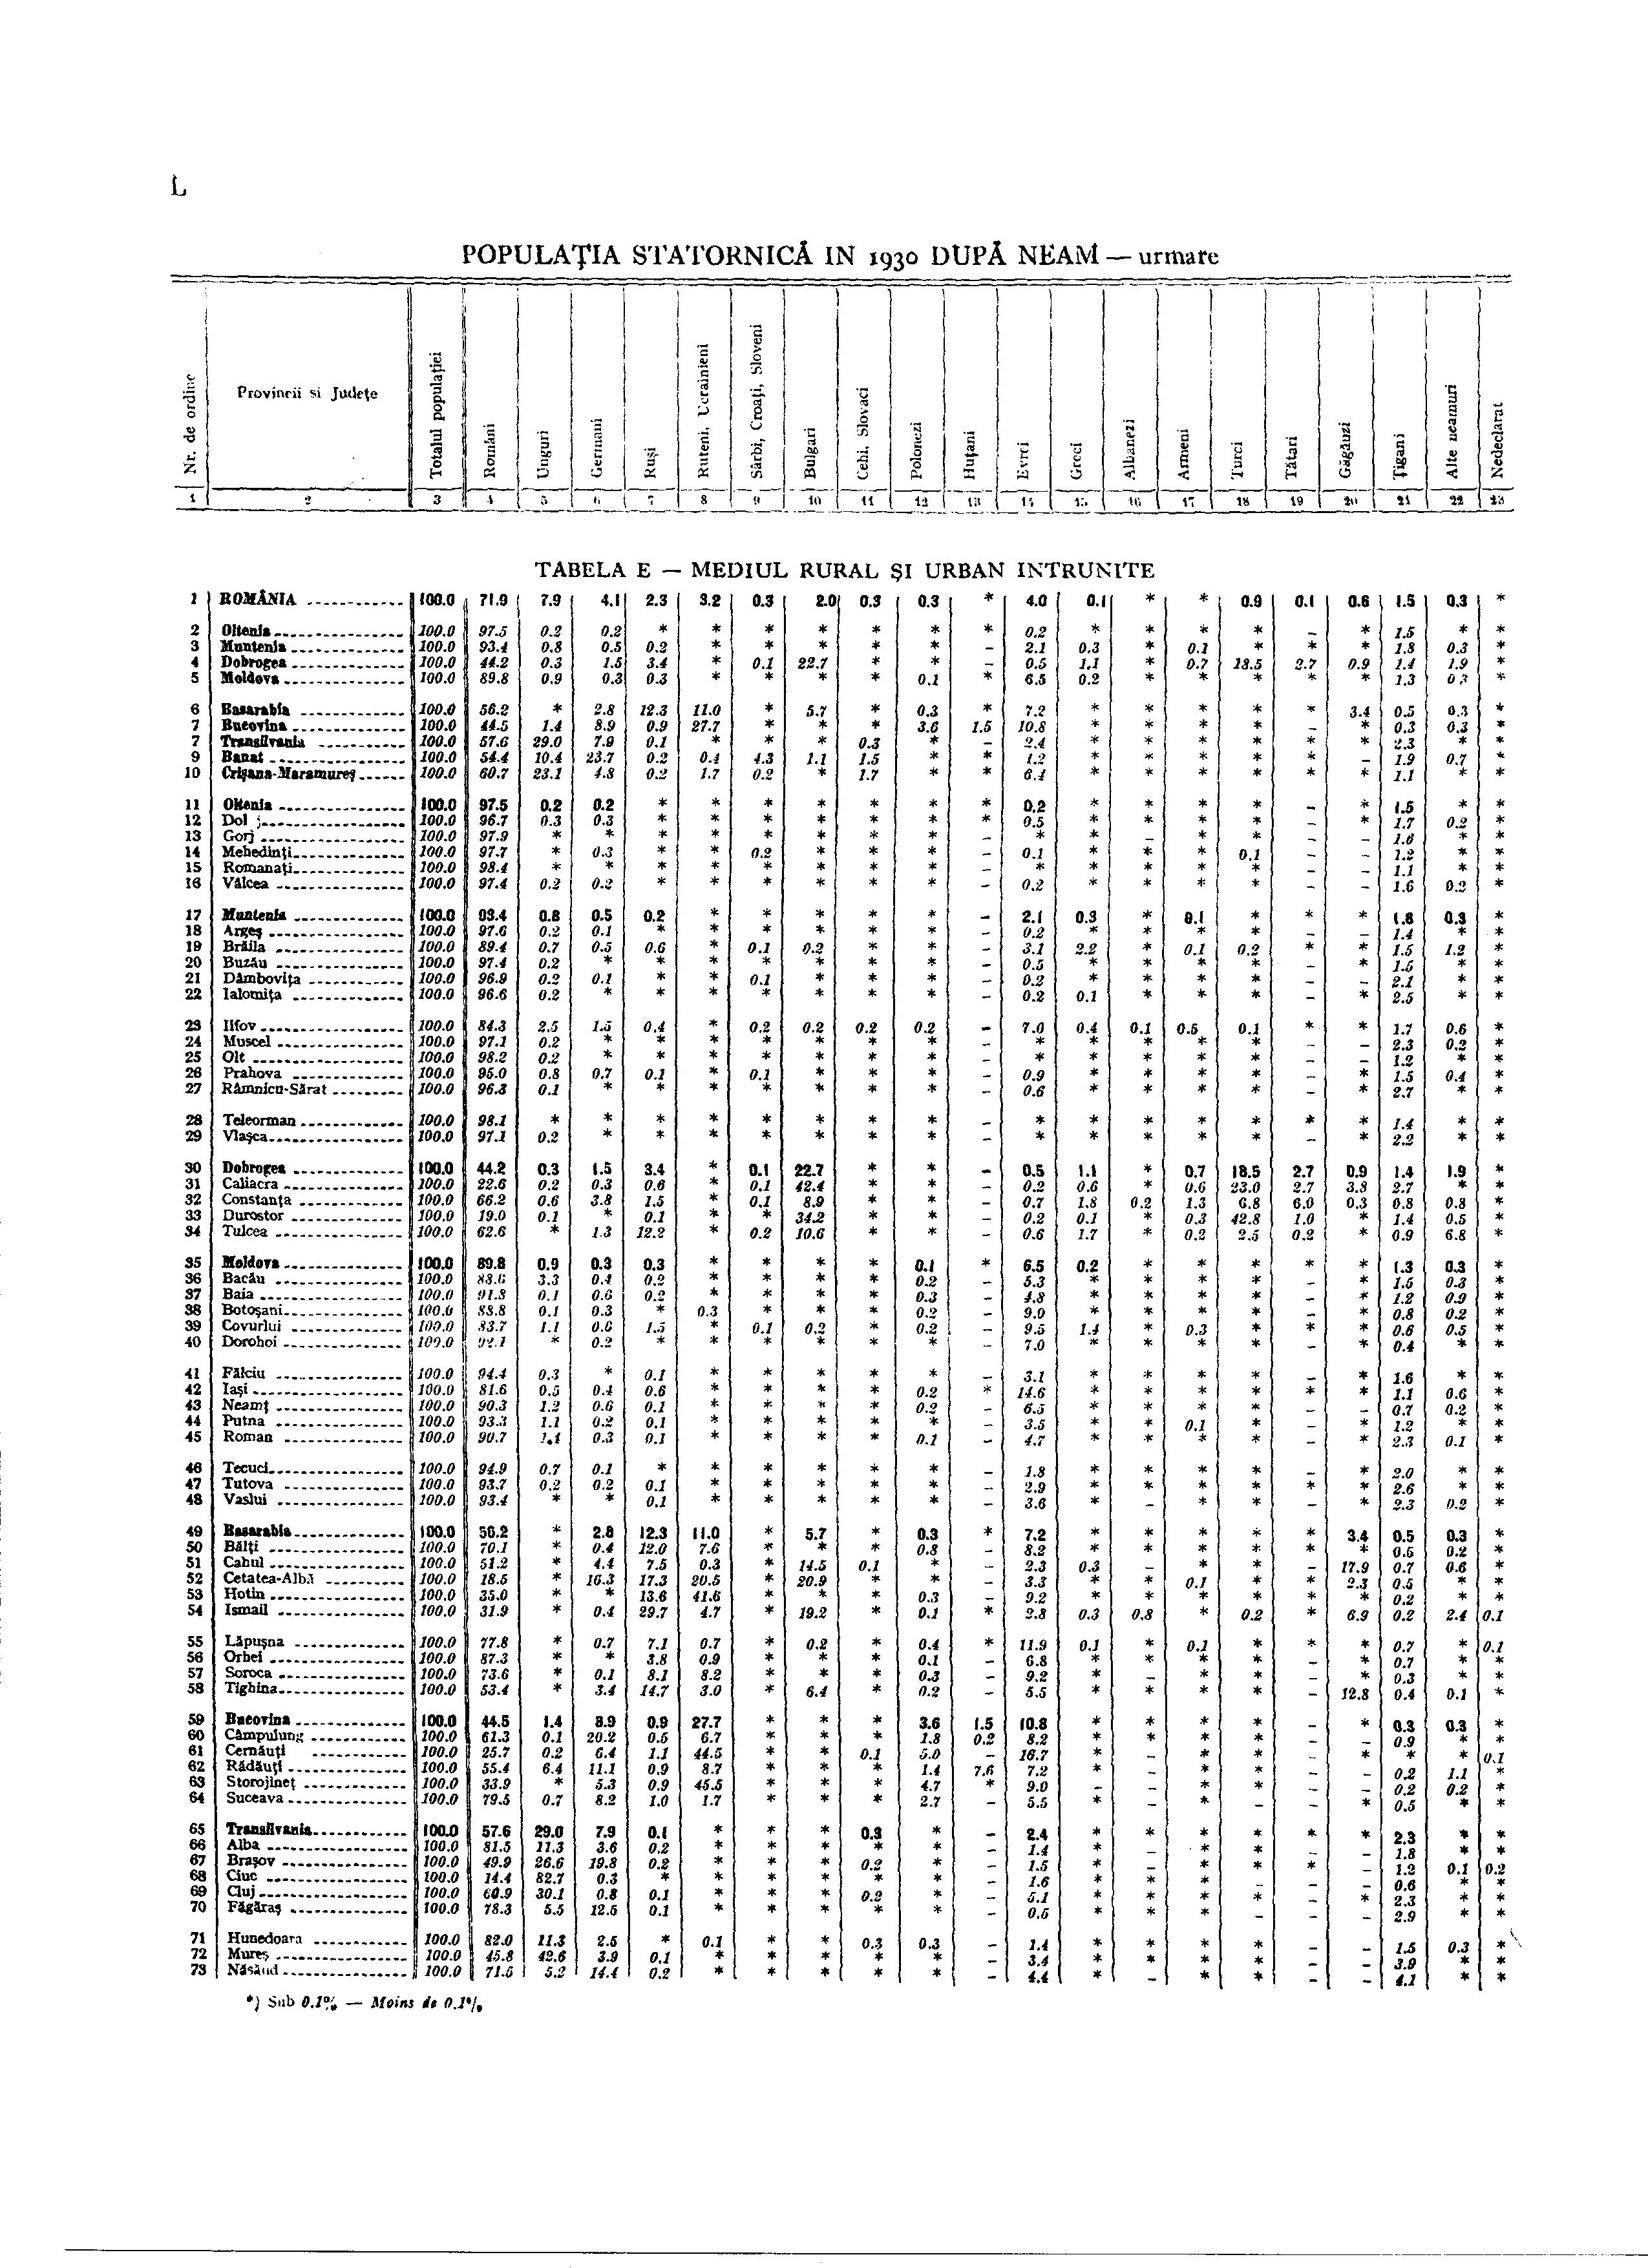
29 December 1930 census
| Ethnicity | number | % |
|---|---|---|
| Romanians | 12,981,324 | 71.9 |
| Hungarians | 1,425,507 | 7.9 |
| Germans | 745,421 | 4.1 |
| Jews | 728,115 | 4.0 |
| Ruthenians and Ukrainians | 582,115 | 3.2 |
| Russians | 409,150 | 2.3 |
| Bulgarians | 366,384 | 2.0 |
| Romani | 262,501 | 1.5 |
| Turks | 154,772 | 0.9 |
| Gagauz | 105,750 | 0.6 |
| Czechs and Slovaks | 51,842 | 0.3 |
| Serbs, Croats and Slovenes | 51,062 | 0.3 |
| Poles | 48,310 | 0.3 |
| Greeks | 26,495 | 0.1 |
| Tatars | 22,141 | 0.1 |
| Armenians | 15,544 | 0.0 |
| Hutsuls | 12,456 | 0.0 |
| Albanians | 4,670 | 0.0 |
| Others | 56,355 | 0.3 |
| Undeclared | 7,114 | 0.0 |
| Total[9] | 18,057,028 | 100.0 |
25 January 1948 census
| Mother tongue | number | % |
|---|---|---|
| Romanian | 13,597,613 | 85.7 |
| Hungarian | 1,499,851 | 9.4 |
| German | 343,913 | 2.2 |
| Yiddish | 138,795 | 0.9 |
| Romani | 53,425 | 0.3 |
| Serbian, Croatian and Slovenian | 45,447 | 0.3 |
| Russian | 39,332 | 0.2 |
| Ukrainian | 37,582 | 0.2 |
| Czech and Slovak | 35,143 | 0.2 |
| Turkish and Tatar | 28,782 | 0.2 |
| Bulgarian | 13,408 | 0.1 |
| Greek | 8,696 | 0.1 |
| Armenian | 6,987 | 0.0 |
| Polish | 6,753 | 0.0 |
| Albanian | 735 | 0.0 |
| Others | 15,639 | 0.2 |
| Undeclared | 523 | 0.0 |
| Total[11] | 15,872,624 | 100.0 |
21 February 1956 census
| Ethnicity | number | % |
|---|---|---|
| Romanians | 14,996,114 | 85.7 |
| Hungarians | 1,587,675 | 9.1 |
| Germans | 384,708 | 2.2 |
| Jews | 146,264 | 0.8 |
| Romani | 104,216 | 0.6 |
| Ukrainians | 60,479 | 0.4 |
| Serbs, Croats and Slovenes | 46,517 | 0.3 |
| Russians | 38,731 | 0.2 |
| Slovaks | 23,331 | 0.2 |
| Tatars | 20,469 | 0.2 |
| Turks | 14,329 | 0.1 |
| Bulgarians | 12,040 | 0.1 |
| Czechs | 11,821 | 0.0 |
| Greeks | 11,166 | 0.0 |
| Poles | 7,627 | 0.0 |
| Armenians | 6,441 | 0.0 |
| Others | 13,357 | 0.1 |
| Undeclared | 4,165 | 0.0 |
| Total[11][12] | 17,489,450 | 100.0 |
15 March 1966 census
| Ethnicity | number | % |
|---|---|---|
| Romanians | 16,746,510 | 87.7 |
| Hungarians | 1,619,592 | 8.5 |
| Germans | 382,595 | 2.0 |
| Romani | 64,197 | 0.3 |
| Ukrainians | 54,705 | 0.3 |
| Serbs, Croats and Slovenes | 44,236 | 0.3 |
| Jews | 42,888 | 0.2 |
| Russians | 39,483 | 0.2 |
| Slovaks | 22,221 | 0.1 |
| Tatars | 22,151 | 0.1 |
| Turks | 18,040 | 0.1 |
| Bulgarians | 11,193 | 0.1 |
| Czechs | 9,978 | 0.0 |
| Greeks | 9,088 | 0.0 |
| Poles | 5,860 | 0.0 |
| Armenians | 3,436 | 0.0 |
| Others | 4,681 | 0.0 |
| Undeclared | 2,309 | 0.0 |
| Total[11][12] | 19,103,163 | 100.0 |
5 January 1977 census
| Ethnicity | number | % |
|---|---|---|
| Romanians | 18,999,565 | 88.1 |
| Hungarians | 1,713,928 | 7.9 |
| Germans | 359,109 | 1.6 |
| Romani | 227,398 | 1.05 |
| Ukrainians | 55,510 | 0.3 |
| Serbs | 34,429 | 0.2 |
| Russians | 32,696 | 0.2 |
| Jews | 24,667 | 0.1 |
| Turks | 23,422 | 0.1 |
| Tatars | 23,369 | 0.1 |
| Slovaks | 21,286 | 0.1 |
| Bulgarians | 10,372 | 0.0 |
| Czechs | 7,683 | 0.0 |
| Croats | 7,500 | 0.0 |
| Greeks | 6,262 | 0.0 |
| Poles | 4,641 | 0.0 |
| Armenians | 2,342 | 0.0 |
| Others | 5,279 | 0.0 |
| Undeclared | 452 | 0.0 |
| Total[11][12] | 21,559,910 | 100.0 |
7 January 1992 census
| Ethnicity | number | % |
|---|---|---|
| Romanians | 20,408,542 | 89.5 |
| Hungarians | 1,624,959 | 7.1 |
| Romani | 401,087 | 1.8 |
| Germans | 119,462 | 0.5 |
| Ukrainians | 65,472 | 0.3 |
| Russians | 38,606 | 0.2 |
| Turks | 29,832 | 0.1 |
| Serbs | 29,408 | 0.1 |
| Tatars | 24,596 | 0.1 |
| Slovaks | 19,594 | 0.1 |
| Bulgarians | 9,851 | 0.1 |
| Jews | 8,955 | 0.0 |
| Czechs | 5,797 | 0.0 |
| Poles | 4,232 | 0.0 |
| Croats | 4,085 | 0.0 |
| Greeks | 3,940 | 0.0 |
| Armenians | 1,957 | 0.0 |
| Others | 8,894 | 0.0 |
| Undeclared | 766 | 0.0 |
| Total[11][12] | 22,810,035 | 100.0 |
18 March 2002 census
| Ethnicity | number | % |
|---|---|---|
| Romanians | 19,399,597 | 89.5 |
| Hungarians | 1,431,807 | 6.6 |
| Romani | 535,140 | 2.5 |
| Ukrainians | 61,098 | 0.3 |
| Germans | 59,764 | 0.3 |
| Lipovan Russians | 35,791 | 0.2 |
| Turks | 32,098 | 0.2 |
| Tatars | 23,935 | 0.1 |
| Serbs | 22,561 | 0.1 |
| Slovaks | 17,226 | 0.1 |
| Bulgarians | 8,025 | 0.0 |
| Croats | 6,807 | 0.0 |
| Greeks | 6,472 | 0.0 |
| Jews | 5,785 | 0.0 |
| Czechs | 3,941 | 0.0 |
| Poles | 3,559 | 0.0 |
| Italians | 3,288 | 0.0 |
| Chinese | 2,243 | 0.0 |
| Armenians | 1,780 | 0.0 |
| Csángó | 1,266 | 0.0 |
| Macedonians | 695 | 0.0 |
| Albanians | 477 | 0.0 |
| Rusyns | 257 | 0.0 |
| Krashovani | 206 | 0.0 |
| Slovenes | 202 | 0.0 |
| Others | 15,013 | 0.1 |
| Undeclared | 1,941 | 0.0 |
| Total[13][14] | 21,680,974 | 100.0 |
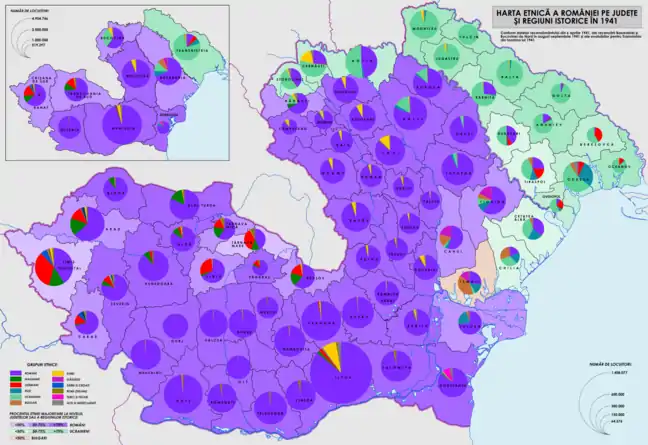
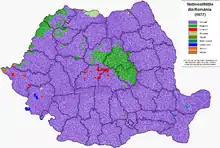
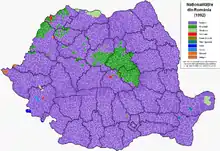
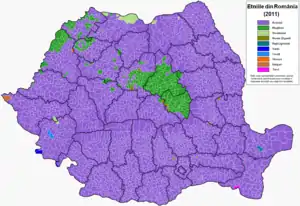
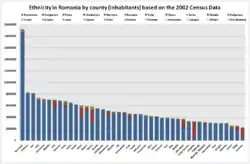 Ethnicity by county and number of inhabitants
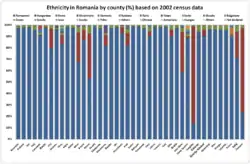 Ethnicity by county and percentage
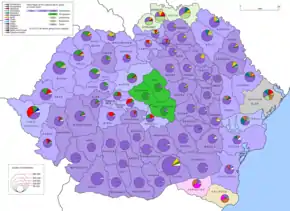
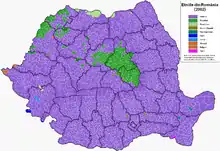
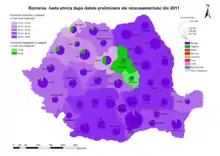
20 October 2011 census
| Ethnicity | number | % |
|---|---|---|
| Romanians | 16,792,868 | 88.9 |
| Hungarians | 1,227,623 | 6.5 |
| Romani | 621,573 | 3.3 |
| Ukrainians | 50,920 | 0.3 |
| Germans | 36,042 | 0.2 |
| Turks | 27,698 | 0.1 |
| Lipovan Russians | 23,487 | 0.1 |
| Tatars | 20,282 | 0.1 |
| Serbs | 18,076 | 0.1 |
| Slovaks | 13,654 | 0.1 |
| Bulgarians | 7,336 | 0.0 |
| Croatians | 5,408 | 0.0 |
| Greeks | 3,668 | 0.0 |
| Jews | 3,271 | 0.0 |
| Italians | 3,203 | 0.0 |
| Poles | 2,543 | 0.0 |
| Czechs | 2,477 | 0.0 |
| Chinese | 2,017 | 0.0 |
| Csángó | 1,536 | 0.0 |
| Armenians | 1,361 | 0.0 |
| Macedonians | 1,264 | 0.0 |
| Others | 18,524 | 0.1 |
| Data unavailable | 1,236,810 | 6.1 |
| Total[15] | 20,121,641 | 100.0 |
Ethnic figures for 2011 are given as a percentage of individuals for whom data is available, while the "data unavailable" cohort is given as a percentage of the total population.
Notes
- "Lista recensămintelor populaţiei din România". Institutul Naţional de Statistică. 2011. Retrieved 3 June 2011.
- Parliamentary Reports. Her Majesty's Stationery Office. 1867. p. 153.
- Statul si cultele religioase (in Romanian)
- The Statesman's Year-Book. St. Martin's Press. 1889. p. 407.
- New International Yearbook. Dodd, Mead and Company. 1915. p. 612.
- The Statesman's Year-book. St. Martin's Press. 1918. p. 1198.
- Recensământul populaţiei din 1930. Populaţia pe Neamuri (in Romanian). Institutul Central de Statistică. p. L. Retrieved 8 June 2014.
- Recensământul populaţiei din 1930. Populaţia pe Neamuri (in Romanian). Institutul Central de Statistică. p. LI. Retrieved 8 June 2014.
- Recensământul populaţiei din 1930. Populaţia pe Neamuri (in Romanian). Institutul Central de Statistică. p. XXIV. Retrieved 8 June 2014.
- Recensămintele României: 1899–1992. Enciclopedia de istorie a României (in Romanian). Editura Meronia. 2002. p. 358.
- "Hungarians in Transylvania between 1870 and 1995". Retrieved 20 July 2008.
- "Populaţia după etnie la recensămintele din perioada 1930–2002, pe judeţe" (PDF) (in Romanian). Institutul Naţional de Statistică. Retrieved 28 October 2011.
- "Populaţia după etnie" (PDF) (in Romanian). Institutul Naţional de Statistică. Retrieved 28 October 2011.
- "Date naţionale" (in Romanian). Erdélyi Magyar Adatbank. Archived from the original on 29 September 2011. Retrieved 28 October 2011.
- "Rezultatele finale ale Recensământului din 2011 - Tab8. Populaţia stabilă după etnie – judeţe, municipii, oraşe, comune" (in Romanian). National Institute of Statistics (Romania). 5 July 2013. Retrieved 18 December 2013.
External links
- 2011 Romanian Census site from the National Institute of Statistics