Demographics of Romania
This article is about the demographic features of the population of Romania, including population density, ethnicity, education level, health of the populace, economic status, religious affiliations and other aspects of the population.
| Demographics of Romania | |
|---|---|
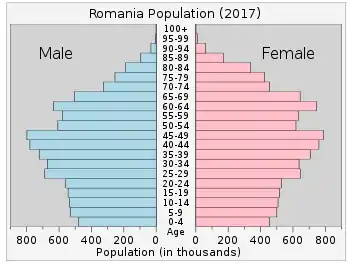
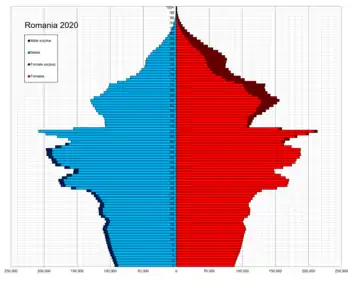 Romania population pyramid in 2020 | |
| Population | 19,317,384 (2020 national population estimate)[1] |
| Growth rate | -0.29% (2014) |
| Birth rate | 9.27 births/1,000 population (2014) |
| Death rate | 11.88 deaths/1,000 population (2014) |
| Life expectancy | 75 years (2015)[2] |
| • male | 71.4 years |
| • female | 78.8 years |
| Fertility rate | 1.76 children born/woman (2018)[3] |
| Infant mortality rate | 9.01 deaths/1,000 live births (2012)[4] |
| Net migration rate | -0.24 migrants/1,000 population (2015) |
| Age structure | |
| 0–14 years | 3,189,646 (15.8%) |
| 15–64 years | 13,684,251 (68.1%) |
| 65 and over | 3,247,744 (16.1%) |
| Sex ratio | |
| Total | 0.95 males/female (2014) |
| At birth | 1.06 males/female |
| Under 15 | 1.05 males/female |
| 15–64 years | 0.99 males/female |
| 65 and over | 0.69 males/female |
| Nationality | |
| Nationality | noun: Romanian(s), adjective: Romanian |
| Major ethnic | Romanian |
| Minor ethnic | Hungarian, Romani, Ukrainian, German, Turkish, Tatar, Russian, Lipovan, Serbian, Slovak, etc. |
| Language | |
| Official | Romanian |
| Spoken | Romanian and other minority languages |
About 88.9% of the people of Romania are ethnic Romanians, whose language, Romanian, is a Balkan Romance language, descended from Latin with some German, French, English, Greek, Slavic, and Hungarian borrowings. Romanians are by far the most numerous group of speakers of a Balkan Romance language today. It has been said that they constitute "an island of Latinity"[5] in Eastern Europe, surrounded on all sides either by Slavic peoples or by the Hungarians. The Hungarian minority in Romania constitutes the country's largest minority, 6.1 per cent of the population.[6]
Population
Romania's population has declined steadily in recent years, from 21.83 million in 2002 to 19.95 million in 2014.[7] Among the causes of population decline are high mortality, a low fertility rate after 1989, and emigration.[7]
In 1990 Romania's population was estimated to be 23.21 million inhabitants.[8] For the entire period 1990–2006 the estimated population loss tops 1.5 million,[8] but it is likely to be higher, given the explosion of migration for work after 2001 and the tendency of some migrants to settle permanently in the countries where they live.[9]
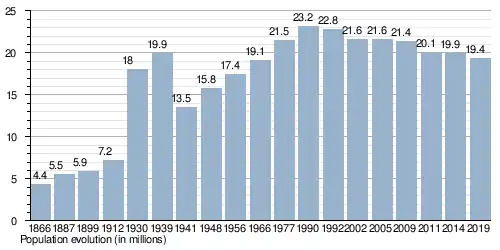
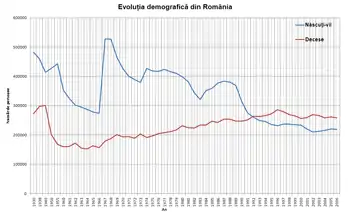
Population evolution
Sources give varied estimates for Romania's historical population. The National Institute for Research and Development in Informatics (NIRDI) gives the following numbers:
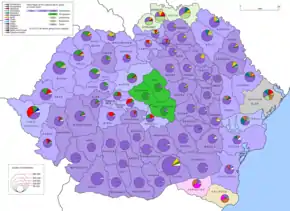
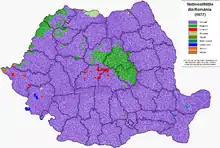
Ethnic groups
.png.webp)
Slightly more than 10% of the population of Romania is formed of minorities of Romania. The principal minorities are Hungarians and Roma, although other smaller ethnic groups exist too. Before World War II, minorities represented more than 28% of the total population. During the war that percentage was halved, largely by the loss of the border areas of Bessarabia and northern Bukovina (to the former Soviet Union, now Moldova and Ukraine) and southern Dobrudja (to Bulgaria). Two-thirds of the ethnic German population either left or were deported after World War II, a period that was followed by decades of relatively regular (by communist standards) migration. During the interwar period in Romania, the total number of ethnic Germans amounted to as much as 786,000 (according to some sources and estimates dating to 1939),[10][11] a figure which had subsequently fallen to circa 36,000 as of 2011 in contemporary Romania. One of the reasons for which the number of Germans in Romania fell is because after the Romanian Revolution there has been a mass migration of Transylvania Saxons to Germany, in what was referred by British daily newspaper Guardian to as 'the most astonishing, and little reported, ethnic migration in modern Europe'.[12]
Of a total official population of over three quarter million Jews before World War II, more than half were killed during the Holocaust.[13] Mass emigration, mostly to Israel and United States, has reduced the surviving Jewish community to less than 6,000 in 2002 (it is estimated that the real numbers could be 3-4 times higher).[14]
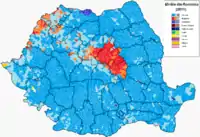
Hungarians (Magyars; see Hungarians in Romania, especially in Harghita, Covasna, and Mureș counties) and Romani (Roma; see Romani people in Romania) are the principal minorities, with a declining German population (Banat Swabians in Timiș; Transylvanian Saxons in Sibiu, Brașov and elsewhere), and smaller numbers of Czechs, Slovaks, Serbs, Croats, and Banat Bulgarians (in Banat), Ukrainians (especially in Maramureș and Bukovina), Greeks of Romania (especially in Brăila and Constanța), Turks and Tatars (mainly in Constanța), Armenians, Russians (Lipovans, Old Believers in Tulcea), Jews and others. Since the Romanian Revolution of 1989, Bucharest and other cities have again become increasingly cosmopolitan, including identifiable presences from outside the EU (Chinese, Turks, Moldovans, Syrians, Iraqis, Africans) as well as from the EU (French, Italians, Germans, British, Greeks).[15] In Romania, there are also guest workers from countries such as Vietnam and Nepal.[16][17]
Minority populations are greatest in Transylvania and the Banat, areas in the north and west of the country, which were part of the Kingdom of Hungary (after 1867 the Austria-Hungary) until the end of World War I. Even before the union with Romania, ethnic Romanians comprised the overall majority in Transylvania. However, ethnic Hungarians and Germans were the dominant urban population until relatively recently, while Hungarians still constitute the majority in Harghita and Covasna counties.
Romani people constitute one of Romania's largest minorities. According to the 2011 census, they number 621,573 people or 3.08% of the total population, being the second-largest ethnic minority in Romania after Hungarians,[18] with significant populations in Mureș (8.9%) and Călărași (7,47%) counties. There are different estimates about the size of the total population of people with Romani ancestry in Romania because a lot of people of Romani descent do not declare themselves Romani. The number of Romani people is usually underestimated in official statistics and may represent 5–11% of Romania's population.[19]
After Hungarians and Romani, Ukrainians of Romania are the third-largest minority. According to the 2011 Romanian census they number 51,703 people, making up 0.3% of the total population.[20] Ukrainians mainly live in northern Romania, in areas close to the Ukrainian border. Over 60% of all Romanian Ukrainians live in Maramureș County (where they make up 6.77% of the population).
Origins
| Ethnicity | number | % |
|---|---|---|
| Romanians | 12,981,324 | 71.9 |
| Hungarians | 1,425,507 | 7.9 |
| Germans | 745,421 | 4.1 |
| Jews | 728,115 | 4.0 |
| Ruthenians and Ukrainians | 582,115 | 3.2 |
| Russians | 409,150 | 2.3 |
| Bulgarians | 366,384 | 2.0 |
| Romani (Gypsies) | 262,501 | 1.5 |
| Turks | 154,772 | 0.9 |
| Gagauzians | 105,750 | 0.6 |
| Czechs and Slovaks | 51,842 | 0.3 |
| Serbs, Croats and Slovenes | 51,062 | 0.3 |
| Poles | 48,310 | 0.3 |
| Greeks | 26,495 | 0.2 |
| Tatars | 22,141 | 0.1 |
| Armenians | 15,544 | <0.1 |
| Hutsuls | 12,456 | <0.1 |
| Albanians | 4,670 | <0.1 |
| Others | 56,355 | 0.3 |
| Undeclared | 7,114 | <0.1 |
| Total | 18,057,028 | 100.0 |
| Ethnic group |
census 19481 | census 19562 | census 19663 | census 19774 | census 19925 | census 20026 | census 20117 | |||||||
|---|---|---|---|---|---|---|---|---|---|---|---|---|---|---|
| Number | % | Number | % | Number | % | Number | % | Number | % | Number | % | Number | % | |
| Romanians | 13,597,613 | 85.7 | 14,996,114 | 85.7 | 16,746,510 | 87.7 | 18,999,565 | 88.1 | 20,408,542 | 89.5 | 19,399,597 | 89.5 | 16,792,868 | 88.9 |
| Hungarians | 1,499,851 | 9.4 | 1,587,675 | 9.1 | 1,619,592 | 8.5 | 1,713,928 | 7.9 | 1,624,959 | 7.1 | 1,431,807 | 6.6 | 1,227,623 | 6.1 |
| Romani (Gypsies) | 53,425 | 0.3 | 104,216 | 0.6 | 64,197 | 0.3 | 227,398 | 1.05 | 401,087 | 1.8 | 535,140 | 2.5 | 621,573 | 3.0 |
| Ukrainians | 37,582 | 0.2 | 60,479 | 0.4 | 54,705 | 0.3 | 55,510 | 0.3 | 65,764 | 0.3 | 61,098 | 0.3 | 50,920 | 0.2 |
| Germans | 343,913 | 2.2 | 384,708 | 2.2 | 382,595 | 2.0 | 359,109 | 1.6 | 119,462 | 0.5 | 59,764 | 0.3 | 36,042 | 0.2 |
| Turks | 28,782 | 0.2 | 14,329 | 0.2 | 18,040 | 0.1 | 23,422 | 0.1 | 29,832 | 0.1 | 32,098 | 0.2 | 27,698 | 0.2 |
| Tatars | 20,469 | 0.2 | 22,151 | 0.1 | 23,369 | 0.1 | 24,596 | 0.1 | 23,935 | 0.1 | 20,282 | 0.1 | ||
| Russians | 39,332 | 0.2 | 38,731 | 0.2 | 39,483 | 0.2 | 21,206 | 0.2 | 7,983 | 0.1 | 35,791 | 0.2 | 23,864 | 0.1 |
| Lipovans | 11,090 | 0.1 | 30,623 | 0.2 | ||||||||||
| Serbs | 45,447 | 0.3 | 46,517 | 0.3 | 44,236 | 0.3 | 34,429 | 0.2 | 29,408 | 0.1 | 22,561 | 0.1 | 18,076 | 0.1 |
| Croats | 7,500 | 0.0 | 4,085 | 0.0 | 6,807 | 0.0 | 5,408 | 0.0 | ||||||
| Slovenes | 175 | 0.0 | ||||||||||||
| Slovaks | 35,143 | 0.2 | 23,331 | 0.2 | 22,151 | 0.1 | 21,286 | 0.1 | 19,594 | 0.1 | 17,226 | 0.2 | 13,654 | 0.1 |
| Czechs | 11,821 | 0.0 | 9,978 | 0.0 | 7,683 | 0.0 | 5,797 | 0.0 | 3,941 | 0.0 | 2,477 | 0.0 | ||
| Bulgarians | 13,408 | 0.1 | 12,040 | 0.1 | 11,193 | 0.1 | 10,372 | 0.0 | 9,851 | 0.1 | 8,025 | 0.0 | 7,336 | 0.0 |
| Greeks | 8,696 | 0.1 | 11,166 | 0.0 | 9,088 | 0.0 | 6,262 | 0.0 | 3,940 | 0.0 | 6,472 | 0.0 | 3,668 | 0.0 |
| Jews | 138,795 | 0.9 | 146,264 | 0.8 | 42,888 | 0.2 | 24,667 | 0.1 | 8,955 | 0.0 | 5,785 | 0.0 | 3,271 | 0.0 |
| Poles | 6,753 | 0.0 | 7,627 | 0.0 | 5,860 | 0.0 | 4,641 | 0.0 | 4,232 | 0.0 | 3,559 | 0.0 | 2,543 | 0.0 |
| Armenians | 6,987 | 0.0 | 6,441 | 0.0 | 3,436 | 0.0 | 2,342 | 0.0 | 1,957 | 0.0 | 1,780 | 0.0 | 1,361 | 0.0 |
| Macedonians | 1,176 | 0.0 | 6,867 | 0.0 | 731 | 0.0 | 1,264 | 0.0 | ||||||
| Csangos | 1,266 | 0.0 | 1,536 | 0.0 | ||||||||||
| Aromanians | 982 | 0.0 | 21,736 | 0.1 | ||||||||||
| Others/undeclared | 15,897 | 0.1 | 17,522 | 0.1 | 6,990 | <0.1 | 5,731 | <0.1 | 9,368 | <0.1 | 28,303 | 0.1 | 23,741 | 0.1 |
| Undeclared | 1,236,810 | 6.14 | ||||||||||||
| Total | 15,872,624 | 17,489,450 | 19,103,163 | 21,559,910 | 22,810,035 | 21,680,974 | 20,121,641 | |||||||
| 1 The results of the 1948 census are according to language. 2 Source:.[22] 3 Source:.[22] 4 Source:.[22] 5 Source:.[22] 6 Source:[23] 7 Source:[24] | ||||||||||||||
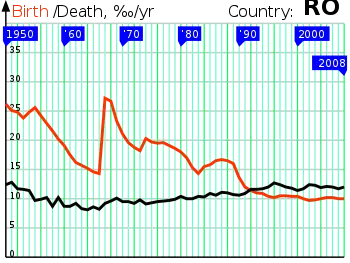
Vital statistics
|
1.9 - 2.1
1.7 - 1.9
1.5 - 1.7
1.4 - 1.5
1.3 - 1.4
< 1.3 |
Total Fertility Rate from 1850 to 1899
The total fertility rate is the number of children born per woman. It is based on fairly good data for the entire period. Sources: Our World In Data and Gapminder Foundation.[25]
| Years | 1850 | 1851 | 1852 | 1853 | 1854 | 1855 | 1856 | 1857 | 1858 | 1859 | 1860[25] |
|---|---|---|---|---|---|---|---|---|---|---|---|
| Total Fertility Rate in Romania | 5.22 | 5.08 | 4.94 | 4.8 | 4.66 | 4.52 | 4.38 | 4.24 | 4.11 | 3.97 | 4.23 |
| Years | 1861 | 1862 | 1863 | 1864 | 1865 | 1866 | 1867 | 1868 | 1869 | 1870[25] |
|---|---|---|---|---|---|---|---|---|---|---|
| Total Fertility Rate in Romania | 4.29 | 4.29 | 4.07 | 4.82 | 4.64 | 4.19 | 4.25 | 4.48 | 4.56 | 4.61 |
| Years | 1871 | 1872 | 1873 | 1874 | 1875 | 1876 | 1877 | 1878 | 1879 | 1880[25] |
|---|---|---|---|---|---|---|---|---|---|---|
| Total Fertility Rate in Romania | 4.49 | 4.29 | 4.36 | 4.6 | 5.2 | 4.96 | 4.74 | 4.22 | 4.97 | 5.05 |
| Years | 1881 | 1882 | 1883 | 1884 | 1885 | 1886 | 1887 | 1888 | 1889 | 1890[25] |
|---|---|---|---|---|---|---|---|---|---|---|
| Total Fertility Rate in Romania | 5.56 | 5.41 | 5.74 | 5.55 | 5.78 | 5.65 | 5.49 | 5.68 | 5.44 | 5.16 |
| Years | 1891 | 1892 | 1893 | 1894 | 1895 | 1896 | 1897 | 1898 | 1899[25] |
|---|---|---|---|---|---|---|---|---|---|
| Total Fertility Rate in Romania | 5.67 | 5.23 | 5.43 | 5.48 | 5.67 | 5.45 | 5.75 | 4.92 | 5.63 |
Before WWI
| Average population | Live births | Deaths | Natural change | Crude birth rate (per 1000) | Crude death rate (per 1000) | Natural change (per 1000) | Total fertility rates[25] | |
|---|---|---|---|---|---|---|---|---|
| 1900 | 6,050,000 | 235,000 | 146,000 | 89,000 | 38.8 | 24.2 | 14.6 | 5.20 |
| 1901 | 6,120,000 | 241,000 | 160,000 | 81,000 | 39.3 | 26.2 | 13.1 | 5.27 |
| 1902 | 6,210,000 | 242,000 | 172,000 | 70,000 | 39.0 | 27.7 | 11.3 | 5.23 |
| 1903 | 6,290,000 | 252,000 | 156,000 | 96,000 | 40.1 | 24.8 | 15.3 | 5.37 |
| 1904 | 6,390,000 | 256,000 | 156,000 | 100,000 | 40.1 | 24.4 | 15.7 | 5.37 |
| 1905 | 6,480,000 | 248,000 | 160,000 | 88,000 | 38.3 | 24.7 | 13.6 | 5.13 |
| 1906 | 6,570,000 | 262,000 | 157,000 | 105,000 | 39.9 | 23.9 | 16.0 | 5.35 |
| 1907 | 6,680,000 | 274,000 | 176,000 | 98,000 | 41.1 | 26.3 | 14.8 | 5.51 |
| 1908 | 6,770,000 | 273,000 | 185,000 | 88,000 | 40.3 | 27.4 | 12.9 | 5.40 |
| 1909 | 6,860,000 | 282,000 | 188,000 | 94,000 | 41.1 | 27.4 | 13.7 | 5.51 |
| 1910 | 6,970,000 | 274,000 | 173,000 | 101,000 | 39.3 | 24.8 | 14.5 | 5.27 |
| 1911 | 7,090,000 | 300,000 | 179,000 | 121,000 | 42.3 | 25.3 | 17.0 | 5.67 |
| 1912 | 7,240,000 | 314,000 | 166,000 | 148,000 | 43.4 | 22.9 | 20.5 | 5.82 |
| 1913 | 7,360,000 | 310,000 | 192,000 | 118,000 | 42.1 | 26.1 | 16.0 | 5.64 |
| 1914 | 7,770,000 | 327,000 | 183,000 | 144,000 | 42.1 | 23.5 | 18.6 | 5.64 |
| 1915 | 7,910,000 | 320,000 | 194,000 | 126,000 | 40.5 | 24.5 | 16.0 | 5.43 |
| Years | 1916 | 1917 | 1918[25] |
|---|---|---|---|
| Total Fertility Rate in Romania | 4.84 | 4.25 | 3.67 |
Between WWI and WWII
| Average population | Live births | Deaths | Natural change | Crude birth rate (per 1000) | Crude death rate (per 1000) | Natural change (per 1000) | Natural change (per 1000) | Total fertility rates[25] | |
|---|---|---|---|---|---|---|---|---|---|
| 1919 | 15,920,000 | 366,000 | 328,000 | 38,000 | 23.0 | 20.6 | 2.4 | 3.08 | |
| 1920 | 16,010,000 | 539,000 | 415,000 | 124,000 | 33.7 | 25.9 | 7.8 | 4.52 | |
| 1921 | 16,240,000 | 620,000 | 372,000 | 248,000 | 38.2 | 22.9 | 15.3 | 5.12 | |
| 1922 | 16,500,000 | 614,000 | 376,000 | 238,000 | 37.2 | 22.8 | 14.4 | 4.98 | |
| 1923 | 16,770,000 | 609,000 | 372,000 | 237,000 | 36.4 | 22.1 | 14.3 | 4.88 | |
| 1924 | 16,990,000 | 623,000 | 383,000 | 240,000 | 36.7 | 22.5 | 14.2 | 4.92 | |
| 1925 | 17,190,000 | 606,000 | 362,000 | 244,000 | 35.2 | 21.1 | 14.1 | 4.72 | |
| 1926 | 17,460,000 | 608,000 | 373,000 | 235,000 | 34.8 | 21.4 | 13.4 | 4.66 | |
| 1927 | 17,690,000 | 603,000 | 393,000 | 210,000 | 34.1 | 22.2 | 11.9 | 4.57 | |
| 1928 | 17,970,000 | 624,000 | 352,000 | 272,000 | 34.7 | 19.6 | 15.1 | 4.65 | |
| 1929 | 17,640,000 | 601,000 | 378,000 | 223,000 | 34.1 | 21.4 | 12.7 | 4.57 | |
| 1930 | 17,870,000 | 625,000 | 347,000 | 278,000 | 35.0 | 19.4 | 15.6 | 4.69 | |
| 1931 | 18,190,000 | 605,000 | 379,000 | 226,000 | 33.3 | 20.8 | 12.5 | 4.46 | |
| 1932 | 18,427,000 | 662,000 | 399,000 | 263,000 | 35.9 | 21.7 | 14.2 | 4.81 | |
| 1933 | 18,653,000 | 598,000 | 348,000 | 250,000 | 32.1 | 18.7 | 13.4 | 4.30 | |
| 1934 | 18,914,000 | 612,416 | 390,668 | 221,748 | 32.4 | 20.7 | 11.7 | 4.34 | |
| 1935 | 19,088,000 | 585,503 | 402,720 | 182,783 | 30.7 | 21.1 | 9.6 | 4.11 | |
| 1936 | 19,319,000 | 608,906 | 382,179 | 226,727 | 31.5 | 19.8 | 11.7 | 4.22 | |
| 1937 | 19,535,000 | 601,310 | 377,954 | 223,356 | 30.8 | 19.3 | 11.4 | 4.13 | |
| 1938 | 19,750,000 | 585,423 | 379,445 | 205,978 | 29.6 | 19.2 | 10.4 | 3.97 | |
| 1939 | 19,934,000 | 563,817 | 370,348 | 193,469 | 28.3 | 18.6 | 9.7 | 3.79 |
| Years | 1940 | 1941 | 1942 | 1943 | 1944 | 1945[25] |
|---|---|---|---|---|---|---|
| Total Fertility Rate in Romania | 3.55 | 3.08 | 2.87 | 3.14 | 2.91 | 2.63 |
After WWII
| Average population | Live births | Deaths | Natural change | Crude birth rate (per 1000) | Crude death rate (per 1000) | Natural change (per 1000) | Total fertility rates[fn 1] | |
|---|---|---|---|---|---|---|---|---|
| 1946 | 15,760,000 | 391,273 | 296,439 | 94,834 | 24.8 | 18.8 | 6.0 | 3.32 |
| 1947 | 15,860,000 | 370,562 | 349,331 | 21,231 | 23.4 | 22.0 | 1.3 | 3.14 |
| 1948 | 15,893,000 | 379,868 | 248,238 | 131,630 | 23.9 | 15.6 | 8.3 | 3.20 |
| 1949 | 16,084,000 | 444,065 | 219,881 | 224,184 | 27.6 | 13.7 | 13.9 | 3.70 |
| 1950 | 16,311,000 | 426,820 | 202,010 | 224,810 | 26.2 | 12.4 | 13.8 | 3.14 |
| 1951 | 16,464,000 | 412,534 | 210,021 | 202,513 | 25.1 | 12.8 | 12.3 | 3.01 |
| 1952 | 16,630,000 | 413,217 | 195,287 | 217,930 | 24.8 | 11.7 | 13.1 | 2.97 |
| 1953 | 16,847,000 | 401,717 | 194,752 | 206,965 | 23.8 | 11.6 | 12.3 | 2.76 |
| 1954 | 17,040,000 | 422,346 | 195,091 | 227,255 | 24.8 | 11.4 | 13.3 | 2.98 |
| 1955 | 17,325,000 | 442,864 | 167,535 | 275,329 | 25.6 | 9.7 | 15.9 | 3.07 |
| 1956 | 17,583,000 | 425,704 | 174,847 | 250,857 | 24.2 | 9.9 | 14.3 | 2.89 |
| 1957 | 17,829,000 | 407,819 | 181,923 | 225,896 | 22.9 | 10.2 | 12.7 | 2.73 |
| 1958 | 18,056,000 | 390,500 | 156,493 | 234,007 | 21.6 | 8.7 | 13.0 | 2.58 |
| 1959 | 18,226,000 | 368,007 | 186,767 | 181,240 | 20.2 | 10.2 | 9.9 | 2.43 |
| 1960 | 18,403,414 | 352,241 | 160,720 | 191,521 | 19.1 | 8.7 | 10.4 | 2.34 |
| 1961 | 18,566,932 | 324,859 | 161,936 | 162,923 | 17.5 | 8.7 | 8.8 | 2.18 |
| 1962 | 18,680,721 | 301,985 | 172,429 | 129,556 | 16.2 | 9.2 | 6.9 | 2.04 |
| 1963 | 18,813,131 | 294,886 | 155,767 | 139,119 | 15.7 | 8.3 | 7.4 | 2.01 |
| 1964 | 18,927,081 | 287,383 | 152,476 | 134,907 | 15.2 | 8.1 | 7.1 | 1.96 |
| 1965 | 19,027,367 | 278,362 | 163,393 | 114,969 | 14.6 | 8.6 | 6.0 | 1.91 |
| 1966 | 19,140,783 | 273,678 | 157,445 | 116,233 | 14.3 | 8.2 | 6.1 | 1.90 |
| 1967 | 19,284,814 | 527,764 | 179,129 | 348,635 | 27.4 | 9.3 | 18.1 | 3.68 |
| 1968 | 19,720,984 | 526,091 | 188,509 | 337,582 | 26.7 | 9.6 | 17.1 | 3.64 |
| 1969 | 20,010,178 | 465,764 | 201,225 | 264,539 | 23.3 | 10.1 | 13.2 | 3.20 |
| 1970 | 20,252,541 | 427,034 | 193,255 | 233,779 | 21.1 | 9.5 | 11.5 | 2.89 |
| 1971 | 20,469,658 | 400,146 | 194,306 | 205,840 | 19.5 | 9.5 | 10.1 | 2.67 |
| 1972 | 20,662,648 | 389,153 | 189,793 | 199,360 | 18.8 | 9.2 | 9.6 | 2.55 |
| 1973 | 20,827,525 | 378,696 | 203,559 | 175,137 | 18.2 | 9.8 | 8.4 | 2.44 |
| 1974 | 21,028,841 | 427,732 | 191,286 | 236,446 | 20.3 | 9.1 | 11.2 | 2.71 |
| 1975 | 21,245,103 | 418,185 | 197,538 | 220,647 | 19.7 | 9.3 | 10.4 | 2.60 |
| 1976 | 21,445,698 | 417,353 | 204,873 | 212,480 | 19.5 | 9.6 | 9.9 | 2.55 |
| 1977 | 21,657,569 | 423,958 | 208,685 | 215,273 | 19.6 | 9.6 | 9.9 | 2.57 |
| 1978 | 21,854,622 | 416,598 | 211,846 | 204,752 | 19.1 | 9.7 | 9.4 | 2.52 |
| 1979 | 22,048,305 | 410,603 | 217,509 | 193,094 | 18.6 | 9.9 | 8.8 | 2.48 |
| 1980 | 22,201,387 | 398,904 | 231,876 | 167,028 | 18.0 | 10.4 | 7.5 | 2.43 |
| 1981 | 22,352,635 | 381,101 | 224,635 | 156,466 | 17.0 | 10.0 | 7.0 | 2.36 |
| 1982 | 22,477,703 | 344,369 | 224,120 | 120,249 | 15.3 | 10.0 | 5.3 | 2.17 |
| 1983 | 22,553,074 | 321,498 | 233,892 | 87,606 | 14.3 | 10.4 | 3.9 | 2.07 |
| 1984 | 22,624,505 | 350,741 | 233,699 | 117,042 | 15.5 | 10.3 | 5.2 | 2.27 |
| 1985 | 22,724,836 | 358,797 | 246,670 | 112,127 | 15.8 | 10.9 | 4.9 | 2.31 |
| 1986 | 22,823,479 | 376,896 | 242,330 | 134,566 | 16.5 | 10.6 | 5.9 | 2.40 |
| 1987 | 22,940,430 | 383,199 | 254,286 | 128,913 | 16.7 | 11.1 | 5.6 | 2.39 |
| 1988 | 23,053,552 | 380,043 | 253,370 | 126,673 | 16.5 | 11.0 | 5.5 | 2.31 |
| 1989 | 23,151,564 | 369,544 | 247,306 | 122,238 | 16.0 | 10.7 | 5.3 | 2.20 |
| 1990 | 23,206,720 | 314,746 | 247,086 | 67,660 | 13.6 | 10.6 | 2.9 | 1.83 |
| 1991 | 23,185,084 | 275,275 | 251,760 | 23,515 | 11.9 | 10.9 | 1.0 | 1.59 |
| 1992 | 22,788,969 | 260,393 | 263,855 | -3,462 | 11.4 | 11.6 | -0.2 | 1.51 |
| 1993 | 22,755,260 | 249,994 | 263,323 | -13,329 | 11.0 | 11.6 | -0.6 | 1.43 |
| 1994 | 22,730,622 | 246,736 | 266,101 | -19,365 | 10.9 | 11.7 | -0.9 | 1.40 |
| 1995 | 22,680,951 | 236,640 | 271,672 | -35,032 | 10.4 | 12.0 | -1.5 | 1.33 |
| 1996 | 22,607,620 | 231,348 | 286,158 | -54,810 | 10.2 | 12.7 | -2.4 | 1.30 |
| 1997 | 22,545,925 | 236,891 | 279,316 | -42,425 | 10.5 | 12.4 | -1.9 | 1.32 |
| 1998 | 22,502,803 | 237,297 | 269,166 | -31,869 | 10.5 | 12.0 | -1.4 | 1.32 |
| 1999 | 22,458,022 | 234,600 | 265,194 | -30,594 | 10.4 | 11.8 | -1.4 | 1.30 |
| 2000 | 22,435,205 | 234,521 | 255,820 | -21,299 | 10.5 | 11.4 | -0.9 | 1.31 |
| 2001 | 22,408,393 | 220,368 | 259,603 | -39,235 | 10.0 | 11.7 | -1.8 | 1.27 |
| 2002 | 21,675,775 | 210,529 | 269,666 | -59,137 | 9.7 | 12.4 | -2.7 | 1.25 |
| 2003 | 21,574,365 | 212,459 | 266,575 | -54,116 | 9.8 | 12.4 | -2.5 | 1.30 |
| 2004 | 21,451,845 | 216,261 | 258,890 | -42,629 | 10.1 | 12.1 | -2.0 | 1.33 |
| 2005 | 21,319,673 | 221,020 | 262,101 | -41,081 | 10.4 | 12.3 | -1.9 | 1.40 |
| 2006 | 21,193,749 | 219,483 | 258,094 | -38,611 | 10.4 | 12.2 | -1.8 | 1.42 |
| 2007 | 20,882,980 | 213,625 | 252,097 | -38,472 | 10.2 | 12.1 | -1.7 | 1.45 |
| 2008 | 20,537,848 | 222,749 | 253,177 | -30,428 | 10.8 | 12.3 | -1.5 | 1.60 |
| 2009 | 20,367,437 | 222,925 | 257,083 | -34,158 | 10.9 | 12.6 | -1.6 | 1.66 |
| 2010 | 20,246,798 | 211,922 | 259,747 | -47,825 | 10.5 | 12.8 | -2.2 | 1.59 |
| 2011 | 20,147,657 | 196,373 | 251,370 | -54,997 | 9.7 | 12.5 | -2.8 | 1.47 |
| 2012 | 20,060,182 | 201,202 | 255,458 | -54,256 | 10.0 | 12.7 | -2.7 | 1.52 |
| 2013 | 19,988,694 | 198,216 | 249,264 | -51,048 | 9.9 | 12.5 | -2.6 | 1.46 |
| 2014 | 19,916,451 | 195,612 | 254,791 | -59,179 | 9.8 | 12.8 | -2.6 | 1.56 |
| 2015 | 19,822,250 | 187,372 | 260,997 | -73,625 | 9.8 | 13.6 | -3.8 | 1.62 |
| 2016 | 19,706,424 | 190,238 | 256,501 | -66,263 | 9.6 | 13.0 | -3.4 | 1.69[28] |
| 2017 | 19,591,668 | 191,496 | 256,761 | -65,265 | 9.7 | 13.0 | -3.3 | 1.71 |
| 2018 | 19,472,072 | 188,755 | 263,316 | -74,561 | 9.6 | 13.4 | -3.8 | 1.76 |
| 2019 | 19,366,221 | 188,189 | 259,936 | -71,747 | 9.7 | 13.4 | -3.7 |
Note: The 2011 Romanian Census gave a figure of 20,121,641.
Current vital statistics
- Number of births January-November 2019 =
 175,380
 - Number of births January-November 2020 = 162,217
- Number of deaths January-November 2019 =
 237,288
 - Number of deaths January-November 2020 =
 260,595
- Natural Decrease January-November 2019 = -61,908
- Natural Decrease January-November 2020 = -98,378
Life expectancy 1950–2015
Average life expectancy at age 0 of the total population.[30]
| Period | Life expectancy in
Years |
|---|---|
| 1950–1955 | 61.15 |
| 1955–1960 | |
| 1960–1965 | |
| 1965–1970 | |
| 1970–1975 | |
| 1975–1980 | |
| 1980–1985 | |
| 1985–1990 | |
| 1990–1995 | |
| 1995–2000 | |
| 2000–2005 | |
| 2005–2010 | |
| 2010–2015 |
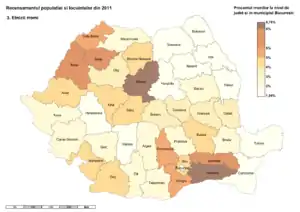
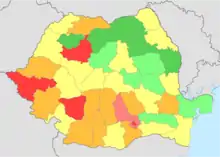
Birth rates by counties
Romania has 41 counties and one city with a special status, namely Bucharest. Ilfov county has the highest crude birth rate (12.0‰), while Vâlcea County has the lowest crude birth rate (6.6‰). Birth rates are generally higher in rural areas compared to urban areas.
Largest urban agglomerations
1. Bucharest 2. Iași 3. Cluj-Napoca 4. Timișoara 5. Constanța 6. Craiova 7. Brașov 8. Galați
Demographics statistics
Demographic statistics according to the World Population Review in 2019.[33]
- One birth every 3 minutes
- One death every 2 minutes
- Net loss of one person every 5 minutes
- One net migrant every 19 minutes
The following demographic statistics are from the CIA World Factbook, unless otherwise indicated.[34]
Population
- 21,457,116 (July 2018 est.)
Median age
- total: 41.6 years. Country comparison to the world: 38th
- male: 40.2 years
- female: 43 years (2018 est.)
Birth rate
- 8.7 births/1,000 population (2018 est.) Country comparison to the world: 211st
Death rate
- 12 deaths/1,000 population (2018 est.) Country comparison to the world: 17th
Total fertility rate
- 1.71 children born/woman (2017) Country comparison to the world: 154th
Net migration rate
- -0.2 migrant(s)/1,000 population (2018 est.) Country comparison to the world: 113rd
- -0.13 migrant(s)/1,000 population (2006 est.)[35]
Mother's mean age at first birth
- 26.7 years (2014 est.)
Population growth rate
- -0.35% (2018 est.) Country comparison to the world: 219th
- -0.127% (2007 estimate).[35]
Urban-rural ratio
Romania is one of the least urbanised countries in Europe. Just a slight majority, 56.4 percent, lives in urban areas (12,546,212 people in total). The remainder, 43.6 percent, lives in rural areas (9,695,506 people in total).[36]
- urban population: 54% of total population (2018)
- rate of urbanization: -0.38% annual rate of change (2015-20 est.)
Sex ratio
- at birth::1.06 male(s)/female
- under 15 years::1.05 male(s)/female
- 15–64 years::0.99 male(s)/female
- 65 years and over::0.71 male(s)/female
- total population::0.95 male(s)/female (2008 est.)
Infant mortality rate
9.2 deaths/1,000 live births (May 2010);[37] down from 17.3 deaths/1,000 live births in 2002.[38]
Life expectancy at birth
- total population: 75.6 years (2018 est.) Country comparison to the world: 106th
- male: 72.1 years (2018 est.)
- female: 79.2 years (2018 est.)
- Total population: 75 years
- male: 71.4 years
- female: 78.8 years (2015 est.)[39]
Literacy
definition: age 15 and over can read and write (2015 est.)
- total population: 98.8%
- male: 99.1%
- female: 98.5% (2015 est.)
School life expectancy (primary to tertiary education)
- total: 14 years
- male: 14 years
- female: 15 years (2016)
Unemployment, youth ages 15-24
- total: 20.6%. Country comparison to the world: 62nd
- male: 19.9%
- female: 21.8% (2016 est.)
Nationality
The noun form is Romanian(s), and the adjectival form is Romanian.
Age structure
- 0-14 years: 14.31% (male 1,576,621 /female 1,493,082)
- 15-24 years: 10.45% (male 1,151,312 /female 1,091,956)
- 25-54 years: 46.11% (male 5,010,272 /female 4,883,090)
- 55-64 years: 12.37% (male 1,244,669 /female 1,409,854)
- 65 years and over: 16.76% (male 1,454,320 /female 2,141,940) (2018 est.)
The following demographic statistics are from National Institute of Statistic on 1 July 2016.
- 0-14 years: 14.7% (male 1,678,542/female 1,586,709)
- 15–64 years: 69.5% (male 7,744,863/female 7,687,078)
- 65 years and over: 15.8% (male 1,420,144/female 2,097,659) (2016 est.)
As a consequence of the pro-natalist policies of the Nicolae Ceaușescu regime (see Decree 770), Romania has a higher proportion of people born in the late 1960s and 1970s its population than any other Western country except Slovenia. The generations born in 1967 and 1968 were the largest, although fertility remained relatively high until 1990. 8.55% of the Romanian population was born in the period from 1976 to 1980, compared with 6.82% of Americans and 6.33% of Britons.[40]
Age structure by ethnicity
Population by ethnicity based on age groups, according to the 2011 census:[41]
| Age group | Total population | Romanians | Hungarians | Roma | Ukrainians | Germans | Turks | Others/Undeclared |
|---|---|---|---|---|---|---|---|---|
| 0-4 | 1,045,029 | 766,078 | 52,158 | 73,860 | 2,606 | 890 | 2,348 | 147,089 |
| 5-9 | 1,054,391 | 804,721 | 55,477 | 69,998 | 3,058 | 990 | 2,095 | 118,052 |
| 10-14 | 1,090,226 | 861,915 | 58,081 | 64,776 | 3,285 | 1,072 | 1,996 | 99,101 |
| 15-19 | 1,108,453 | 911,478 | 59,737 | 53,768 | 3,712 | 1,158 | 1,651 | 76,949 |
| 20-24 | 1,366,374 | 1,119,417 | 76,714 | 60,542 | 3,770 | 1,488 | 2,261 | 102,182 |
| 25-29 | 1,303,077 | 1,048,482 | 74,135 | 49,452 | 3,545 | 1,459 | 2,117 | 123,887 |
| 30-34 | 1,522,719 | 1,241,284 | 90,620 | 51,267 | 3,692 | 1,770 | 2,452 | 131,634 |
| 35-39 | 1,538,897 | 1,283,084 | 95,034 | 45,551 | 3,710 | 1,999 | 2,403 | 107,116 |
| 40-44 | 1,743,878 | 1,493,176 | 103,663 | 39,351 | 3,530 | 2,672 | 2,319 | 99,167 |
| 45-49 | 1,076,258 | 924,664 | 66,469 | 24,319 | 3,082 | 1,933 | 1,642 | 54,149 |
| 50-54 | 1,332,266 | 1,156,851 | 80,134 | 25,816 | 3,259 | 2,530 | 1,732 | 61,944 |
| 55-59 | 1,448,043 | 1,255,293 | 94,852 | 23,064 | 3,109 | 3,375 | 1,554 | 66,796 |
| 60-64 | 1,244,286 | 1,084,578 | 82,353 | 15,976 | 2,874 | 2,523 | 1,090 | 54,892 |
| 65-69 | 890,340 | 766,197 | 74,709 | 8,708 | 2,238 | 2,796 | 682 | 35,010 |
| 70-74 | 901,370 | 792,445 | 63,963 | 7,063 | 2,190 | 3,525 | 560 | 31,624 |
| 75-79 | 72,9965 | 646,048 | 48,315 | 4,803 | 1,697 | 2,734 | 430 | 25,938 |
| 80-84 | 462,807 | 407,295 | 32,265 | 2,346 | 1,021 | 1,947 | 231 | 17,702 |
| 85+ | 263,262 | 229,862 | 18,944 | 913 | 542 | 1,181 | 135 | 11,685 |
Immigration
Foreign-born population (according to Eurostat):[42]
| 2013 | 2015 | 2017 | |
|---|---|---|---|
| Population total | 19,724,074 | 19,720,647 | 19,644,350 |
| Total | 182,939 | 281,048 | 421,801 |
| 59,670 | 114,654 | 161,846 | |
| 22,486 | 38,580 | 56,515 | |
| 18,827 | 29,937 | 42,165 | |
| 8,743 | 11,900 | 16,729 | |
| 2,604 | 5,208 | 15,346 | |
| 3,759 | 6,552 | 15,121 | |
| 3,780 | 6,471 | 12,589 | |
| 11,163 | 10,465 | 10,646 | |
| 5,795 | 6,420 | 8,184 | |
| 5,057 | 3 | 7,986 | |
| 4,085 | 4,653 | 6,494 | |
| 4,952 | 5,269 | 6,063 | |
| 2,978 | 3,722 | 5,068 | |
| 2,360 | 2,876 | 4,428 | |
| 2,295 | 2,576 | 3,492 | |
| 1,665 | 1,837 | 2,936 | |
| 54 | 1,102 | 2,650 | |
| 1,136 | 1,419 | 2,338 | |
| 1,529 | 5,783 | 2,296 | |
| 121 | 509 | 1,934 | |
| 22 | 657 | 1,876 | |
| 1,034 | 1,062 | 1,627 | |
| 1,114 | 1,261 | 1,464 | |
| 81 | 364 | 1,377 | |
| 102 | 301 | 1,189 | |
| 90 | 329 | 978 | |
| 103 | 298 | 932 |
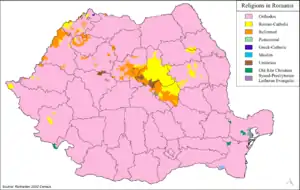
Religion
.png.webp)
- Romanian Orthodox — 86.7%
- Roman Catholic — 4.7%
- Protestant Churches (Calvin, Lutheran, Unitarian, Pentecostal, Baptist, Adventist) — 5.3%
- Greek Catholic - Uniate — 0.9%
- Islam — 0.3%
- Atheist — ≈0.04% (9,271 people)
- No religion — 0.1%
- Other religions — 2.0%
- Refused to declare — 0.1%
Religious affiliation tends to follow ethnic lines, with most ethnic Romanians identifying with the Romanian Orthodox Church. The Greek Catholic or Uniate church, reunified with the Orthodox Church by fiat in 1948, was restored after the 1989 revolution. The 2002 census indicates that 0.9% of the population is Greek Catholic, as opposed to about 10% prior to 1948. Roman Catholics, largely ethnic Hungarians and Germans, constitute 4.7% of the population; Calvinists, Baptists (see Baptist Union of Romania and Convention of the Hungarian Baptist Churches of Romania), Pentecostals, and Lutherans make up another 5%. There are smaller numbers of Unitarians, Muslims, and other religions.
Notes
- In fertility rates, 2.1 and above is a stable population and has been marked blue, 2 and below leads to an aging population and the result is that the population decreases.
References
- "Populaţia rezidentă la 1 ianuarie 2020" [The usually resident population on 1 January 2020] (PDF). insse.ro (in Romanian). Institutul Național de Statistică. Retrieved 28 August 2020.
- "Life expectancy". World Health Organization.
- "Eurostat - Tables, Graphs and Maps Interface (TGM) table". Ec.europa.eu. Retrieved 3 October 2017.
- "European health for all database (HFA-DB)". World Health Organization Regional Office for Europe.
- See, for example, Fabio Bordignon, "Italian Decentralisation in Romania", SEF 2003, Warsaw. Abstract available online. Archived 2007-09-26 at the Wayback Machine
- "COMUNICAT DE PRESĂ : 2 februarie 2012 privind rezultatele provizorii ale Recensământului Populaţiei şi Locuinţelor" (PDF). Recensamantromania.ro. 2011. Retrieved 3 October 2017.
- "Populația României, creșterea alarmantă: Suntem la nivelul Germaniei. Anual cresc 17 orașe mici". Ziare.com (in Romanian). 10 December 2015.
- World Population Prospects. The 2010 Revision (PDF) (Report). Volume I: Comprehensive Tables. Department of Economic and Social Affairs, Population Division, United Nations, New York. 2011. p. 162.
- Vasile Ghețău (2007). Declinul demografic și viitorul populației României. O perspectivă din anul 2007 asupra populației României în secolul 21 (PDF). Institutul Național de Cercetări Economice al Academiei Române (in Romanian). Editura Alpha MDN. ISBN 978-973-7871-88-6. Archived from the original (PDF) on 2016-10-20. Retrieved 2016-08-04.
- Dr. Gerhard Reichning, Die deutschen Vertriebenen in Zahlen, Teil 1, Bonn 1995, Page 17
- Die deutschen Vertreibungsverluste. Bevölkerungsbilanzen für die deutschen Vertreibungsgebiete 1939/50. Herausgeber: Statistisches Bundesamt – Wiesbaden. - Stuttgart: Kohlhammer Verlag, 1958 Page 46
- Jenkins, Simon (2009-10-01). "A forgotten Saxon world shows how ancient and modern can co-exist". The Guardian. Retrieved 2018-09-25.
- "Estimated Number of Jews Killed in the Final Solution". Jewishvirtuallibrary.org. Retrieved 3 October 2017.
- Comunitati evreiesti din România Archived 2005-12-02 at the Wayback Machine, B'nai B'rith International and Federația Comunitatii Evreiesti din România. Accessed online 4 December 2006
- "Locuitorii străini ai Capitalei: Peste 30.000 de migranţi, înregistraţi în Bucureşti".
- "Firmele caută angajaţi în Asia. Pe un şantier din Bucureşti, lucrează zeci de vietnamezi".
- "Nepalezii, soluția de criză a angajatorilor din România. Cei mai mulți lucrează în industria alimentară".
- "Romanian 2011 census" (PDF) (in Romanian). www.edrc.ro. Retrieved 2011-12-10.
- "Europe :: Romania — the World Factbook - Central Intelligence Agency".
- (in Romanian) "Comunicat de presă privind rezultatele provizorii ale Recensământului Populației și Locuințelor – 2011", at the 2011 census site; accessed February 2, 2012.
- Populația pe Neamuri (in Romanian). Institutul Central de Statistică. pp. XXIV. Retrieved 2008-07-20.
- Varga E. Árpád. "Hungarians in Transylvania between 1870 and 1995. Supplementary Tables". Kia.hu. Retrieved 2018-04-11.
- "Population data" (PDF). www.insse.ro. Archived from the original (PDF) on 2013-11-09. Retrieved 2014-07-15.
- "Microsoft Word - REZULTATE DEFINITIVE RPL2011.doc" (PDF). Retrieved 2018-04-11.
- Max Roser (2014), "Total Fertility Rate around the world over the last centuries", Our World In Data, Gapminder Foundation, archived from the original on 2019-02-09, retrieved 2019-02-07
- "Eurostat - Tables, Graphs and Maps Interface (TGM) table". Epp.eurostat.ec.europa.eu. Retrieved 3 October 2017.
- "Bun venit la Institutul National de Statistica - Institutul National de Statistica". Insse.ro. Retrieved 3 October 2017.
- "Eurostat - Tables, Graphs and Maps Interface (TGM) table". ec.europa.eu.
- "Vital statistics". National Institute of Statistics. Retrieved 10 December 2020.
- "World Population Prospects - Population Division - United Nations". esa.un.org. Archived from the original on 2016-09-19. Retrieved 2018-08-26.
- "Demographic evenements in 2016" (PDF). Insse.ro. Archived from the original (PDF) on 23 November 2017. Retrieved 11 April 2018.
- "Population at 20 October 2011" (in Romanian). INSSE. 5 July 2013. Retrieved 5 July 2013.
- "Romania Population 2019", World Population Review
- "World Factbook EUROPE : Romania", The World Factbook, 12 July 2018
 This article incorporates text from this source, which is in the public domain.
 - "The World Factbook — Central Intelligence Agency". Cia.gov. Retrieved 3 October 2017.
- "POPULAŢIA ROMÂNIEI PE LOCALITĂŢI LA 1 IANUARIE 2016" (PDF). Insse.ro. Retrieved 11 April 2018.
- Populatia Romaniei, in continua scadere, July 12, 2010, Wall-street.ro, Accessed online on August 2, 2012
- "UNDP Romania" (PDF). Undp.ro. Archived from the original (PDF) on 3 October 2017. Retrieved 3 October 2017.
- "GHO - By category - Life expectancy and Healthy life expecancy - Data by country". apps.who.int.
- "Countries Compared by People > Total population > Age 25-29 > % of the total. International Statistics". NationMaster.com. Archived from the original on 5 November 2012. Retrieved 3 October 2017.
- "VOLUMUL II: POPULAŢIA STABILĂ (REZIDENTĂ) – STRUCTURA ETNICĂ ŞI CONFESIONALĂ". Retrieved 2020-10-11.
- "Population on 1 January by age group, sex and country of birth". Eurostat.
External links
| Wikimedia Commons has media related to Demographics of Romania. |
- United Nations Statistics - Romania
- Romanian National Statistic Institute (site is in Romanian language, pdf files are in Romanian and English)
- Population density map

According to the 2011 census | ||
| Officially recognised minorities |
| 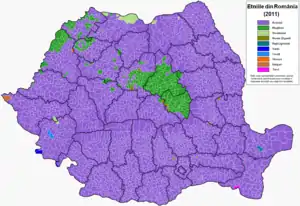 Main ethnicities in the localities (2011) |
| Historical ethnic groups |
| |
| Recent immigrants | ||