Demographics of Barbados
This article is about the demographics of Barbados, including population density, ethnicity, education level, health of the populace, economic status, religious affiliations and other aspects of the population.
Population

At the 2010 census Barbados had an estimated population of 277,821.[1] The tabulated population was only 226,193 due to a high undercount (estimated at 18%). The estimated population of 2018 is 286,641 (the 2019 revision of the World Population Prospects[2][3]).
Race
The population of Barbados is predominantly black (91%) or mixed (4%).[1] 3.5% of the population is white and 1% South Asian. The remaining 0.5% of the population includes East Asians (0.1%).
Languages
English is the official language of Barbados, and is used for communications, administration, and public services all over the island. In its capacity as the official language of the country, the standard of English tends to conform to the vocabulary, pronunciations, spellings, and conventions akin to, but not exactly the same as, those of British English.
A regional variant of English referred to locally as Bajan is spoken by most Barbadians in everyday life especially in informal settings.[4] In its full-fledged form, Bajan sounds markedly different from the Standard English heard on the island. The degree of intelligibility between Bajan and general English depends on the level of creolised vocabulary and idioms. A Bajan speaker may be completely unintelligible to an English speaker from another country. Bajan is influenced by other Caribbean English dialects.
There was no indigenous language on Barbados.
Religion
According to the 2010 census, 75.6% of the population of Barbados are considered Christian, 2.6% have a non-Christian religion and 20.6% have no religion.[1]
Anglicanism constitutes the largest religious group, with 23.9% of the population. It is represented by the Church in the Province of the West Indies, within which the island belongs to the Diocese of Barbados. Pentecostals are the second largest group (19.5%).
The next largest group are Seventh-day Adventists, 5.9% of the population, followed by Methodists (4.2%). 3.8% of the population are Roman Catholics. Other Christians include Wesleyans (3.4%), Nazarenes (3.2%), Church of God (2.4%), Jehovah's Witnesses (2.0%), Baptists (1.8), Moravians (1.2%), Brethren Christian (0.5%), the Salvationists (0.4%) and Latter-day Saints ( 0.1%).
The number of non-Christians is small. 0.7% of the population are Muslims, most of whom are immigrants or descendants of Indian immigrants from the Indian state of Gujarat. There are three mosques and an Islamic centre. Other religious groups include the Rastafarians (1.0% of the population), which was introduced to Barbados in 1975,[5] Hindus (0.5%), Jews (0.05%), the Baháʼís (0.04%) and Buddhists.
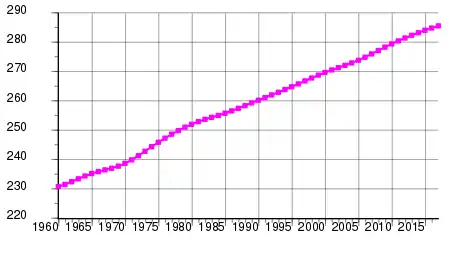
Historical statistics
| Year | Pop. | ±% p.a. |
|---|---|---|
| 1844 | 122,198 | — |
| 1851 | 135,939 | +1.53% |
| 1861 | 152,727 | +1.17% |
| 1871 | 162,042 | +0.59% |
| 1881 | 171,860 | +0.59% |
| 1891 | 182,867 | +0.62% |
| 1911 | 172,337 | −0.30% |
| 1921 | 156,774 | −0.94% |
| 1946 | 192,800 | +0.83% |
| 1960 | 232,327 | +1.34% |
| 1970 | 236,891 | +0.19% |
| 1980 | 247,129 | +0.42% |
| 1990 | 260,491 | +0.53% |
| 2000 | 268,792 | +0.31% |
| 2010 | 277,821 | +0.33% |
| Source:[6] | ||
| Average population[7] | Live births | Deaths | Natural change | Crude birth rate (per 1000) | Crude death rate (per 1000) | Natural change (per 1000) | Infant mortality rate[8] | TFR | |
|---|---|---|---|---|---|---|---|---|---|
| 1934 | 166 000 | 5 380 | 4 176 | 1 204 | 32.4 | 25.2 | 7.3 | ||
| 1935 | 168 000 | 5 315 | 3 702 | 1 613 | 31.6 | 22.0 | 9.6 | 4.75 | |
| 1936 | 170 000 | 5 933 | 3 459 | 2 474 | 34.9 | 20.3 | 14.6 | ||
| 1937 | 173 000 | 5 670 | 3 511 | 2 159 | 32.8 | 20.3 | 12.5 | ||
| 1938 | 175 000 | 5 327 | 3 743 | 1 584 | 30.4 | 21.4 | 9.1 | ||
| 1939 | 177 000 | 5 497 | 3 380 | 2 117 | 31.1 | 19.1 | 12.0 | ||
| 1940 | 179 000 | 5 784 | 3 305 | 2 479 | 32.3 | 18.5 | 13.8 | ||
| 1941 | 179 000 | 5 786 | 3 902 | 1 884 | 32.3 | 21.8 | 10.5 | ||
| 1942 | 180 000 | 5 586 | 3 275 | 2 311 | 31.0 | 18.2 | 12.8 | ||
| 1943 | 182 000 | 5 877 | 3 104 | 2 773 | 32.3 | 17.1 | 15.2 | ||
| 1944 | 183 000 | 5 928 | 3 341 | 2 587 | 32.4 | 18.3 | 14.1 | ||
| 1945 | 187 000 | 6 047 | 3 164 | 2 883 | 32.3 | 16.9 | 15.4 | 5.13 | |
| 1946 | 193 000 | 6 175 | 3 289 | 2 886 | 32.0 | 17.0 | 15.0 | ||
| 1947 | 197 000 | 6 425 | 3 204 | 3 221 | 32.6 | 16.3 | 16.4 | ||
| 1948 | 202 000 | 6 517 | 3 141 | 3 376 | 32.3 | 15.5 | 16.7 | ||
| 1949 | 206 000 | 6 357 | 2 979 | 3 378 | 30.9 | 14.5 | 16.4 | ||
| 1950 | 211 000 | 6 432 | 2 688 | 3 744 | 30.5 | 12.7 | 17.7 | ||
| 1951 | 216 000 | 6 793 | 3 000 | 3 793 | 31.5 | 13.9 | 17.6 | ||
| 1952 | 220 000 | 7 291 | 3 186 | 4 105 | 33.2 | 14.5 | 18.7 | ||
| 1953 | 223 000 | 7 304 | 2 997 | 4 307 | 32.8 | 13.5 | 19.3 | ||
| 1954 | 225 000 | 7 576 | 2 544 | 5 032 | 33.6 | 11.3 | 22.3 | ||
| 1955 | 227 000 | 7 593 | 2 887 | 4 706 | 33.4 | 12.7 | 20.7 | 4.48 | |
| 1956 | 228 000 | 7 082 | 2 430 | 4 652 | 31.0 | 10.6 | 20.4 | ||
| 1957 | 229 000 | 7 314 | 2 469 | 4 845 | 31.9 | 10.8 | 21.1 | ||
| 1958 | 230 000 | 7 115 | 2 298 | 4 817 | 31.0 | 10.0 | 21.0 | ||
| 1959 | 230 000 | 7 110 | 2 084 | 5 026 | 30.9 | 9.1 | 21.8 | ||
| 1960 | 231 000 | 7 833 | 2 127 | 5 706 | 33.9 | 9.2 | 24.7 | ||
| 1961 | 232 000 | 6 754 | 2 410 | 4 344 | 29.2 | 10.4 | 18.8 | ||
| 1962 | 233 000 | 6 881 | 2 116 | 4 765 | 29.6 | 9.1 | 20.5 | ||
| 1963 | 234 000 | 6 756 | 2 090 | 4 666 | 28.9 | 8.9 | 20.0 | ||
| 1964 | 234 000 | 6 506 | 2 127 | 4 379 | 27.7 | 9.1 | 18.7 | ||
| 1965 | 235 000 | 6 358 | 1 905 | 4 453 | 27.0 | 8.1 | 18.9 | 3.56 | |
| 1966 | 236 000 | 6 319 | 2 012 | 4 307 | 26.8 | 8.5 | 18.3 | 3.52 | |
| 1967 | 236 000 | 5 455 | 2 047 | 3 408 | 23.1 | 8.7 | 14.4 | 3.14 | |
| 1968 | 237 000 | 5 474 | 2 045 | 3 429 | 23.1 | 8.6 | 14.5 | 3.15 | |
| 1969 | 238 000 | 5 196 | 1 987 | 3 209 | 21.9 | 8.4 | 13.5 | 2.91 | |
| 1970 | 239 000 | 4 883 | 2 064 | 2 819 | 20.5 | 8.6 | 11.8 | 2.77 | |
| 1971 | 240 000 | 5 177 | 2 058 | 3 119 | 21.6 | 8.6 | 13.0 | 2.90 | |
| 1972 | 241 000 | 5 303 | 2 045 | 3 258 | 22.0 | 8.5 | 13.5 | 3.04 | |
| 1973 | 243 000 | 5 084 | 2 287 | 2 797 | 20.9 | 9.4 | 11.5 | 2.88 | |
| 1974 | 244 000 | 4 851 | 2 107 | 2 744 | 19.8 | 8.6 | 11.2 | 2.71 | |
| 1975 | 246 000 | 4 683 | 2 147 | 2 536 | 19.1 | 8.7 | 10.3 | 2.53 | |
| 1976 | 247 000 | 4 593 | 2 266 | 2 327 | 18.6 | 9.2 | 9.4 | 2.40 | |
| 1977 | 247 000 | 4 326 | 2 144 | 2 182 | 17.5 | 8.7 | 8.8 | 2.27 | |
| 1978 | 248 000 | 4 304 | 2 087 | 2 217 | 17.4 | 8.4 | 9.0 | 2.04 | |
| 1979 | 248 000 | 4 269 | 2 128 | 2 141 | 17.2 | 8.6 | 8.6 | 1.94 | |
| 1980 | 249 000 | 4 148 | 2 012 | 2 136 | 16.7 | 8.1 | 8.6 | 1.83 | |
| 1981 | 250 000 | 4 413 | 1 878 | 2 535 | 17.7 | 7.5 | 10.2 | 1.92 | |
| 1982 | 251 000 | 4 499 | 2 003 | 2 496 | 17.9 | 8.0 | 10.0 | 1.94 | |
| 1983 | 252 000 | 4 496 | 2 068 | 2 428 | 17.8 | 8.2 | 9.6 | 1.94 | |
| 1984 | 253 000 | 4 214 | 1 976 | 2 238 | 16.6 | 7.8 | 8.8 | 1.85 | |
| 1985 | 254 000 | 4 281 | 2 127 | 2 154 | 16.8 | 8.4 | 8.5 | 1.86 | |
| 1986 | 255 000 | 4 043 | 2 160 | 1 883 | 15.8 | 8.5 | 7.4 | 1.81 | |
| 1987 | 257 000 | 3 828 | 2 195 | 1 633 | 14.9 | 8.6 | 6.4 | 1.76 | |
| 1988 | 257 000 | 3 745 | 2 233 | 1 512 | 14.5 | 8.7 | 5.9 | 1.74 | |
| 1989 | 258 000 | 4 015 | 2 277 | 1 738 | 15.5 | 8.8 | 6.7 | 1.81 | |
| 1990 | 259 000 | 4 313 | 2 232 | 2 081 | 16.6 | 8.6 | 8.0 | 1.85 | |
| 1991 | 260 000 | 4 240 | 2 283 | 1 957 | 16.3 | 8.8 | 7.5 | 1.84 | |
| 1992 | 261 000 | 4 185 | 2 361 | 1 824 | 16.0 | 9.0 | 7.0 | 1.82 | |
| 1993 | 262 000 | 3 781 | 2 391 | 1 390 | 14.4 | 9.1 | 5.3 | 1.75 | |
| 1994 | 262 000 | 3 547 | 2 295 | 1 252 | 13.5 | 8.7 | 4.8 | 1.70 | |
| 1995 | 263 000 | 3 473 | 2 481 | 992 | 13.2 | 9.4 | 3.8 | 1.68 | |
| 1996 | 264 000 | 3 519 | 2 400 | 1 119 | 13.3 | 9.1 | 4.2 | 1.69 | |
| 1997 | 265 000 | 3 784 | 2 297 | 1 487 | 14.3 | 8.7 | 5.6 | 1.72 | |
| 1998 | 265 000 | 3 612 | 2 471 | 1 141 | 13.6 | 9.3 | 4.3 | 1.66 | |
| 1999 | 266 000 | 3 882 | 2 428 | 1 454 | 14.6 | 9.1 | 5.5 | 1.71 | |
| 2000 | 267 000 | 3 762 | 2 430 | 1 332 | 14.1 | 9.1 | 5.0 | 1.70 | |
| 2001 | 268 000 | 3 800 | 2 500 | 1 300 | 14.2 | 9.3 | 4.8 | 1.69 | |
| 2002 | 270 000 | 3 812 | 2 285 | 1 527 | 14.1 | 8.5 | 5.7 | 1.69 | |
| 2003 | 271 000 | 3 748 | 2 274 | 1 474 | 13.8 | 8.4 | 5.4 | 1.67 | |
| 2004 | 272 000 | 3 473 | 2 424 | 1 049 | 12.8 | 8.9 | 3.9 | 1.60 | |
| 2005 | 273.018 | 3 508 | 2 162 | 1 346 | 12.6 | 7.9 | 4.7 | 8.3 | 1.58 |
| 2006 | 273.426 | 3 414 | 2 317 | 1 097 | 12.4 | 8.5 | 3.9 | 11.1 | 1.56 |
| 2007 | 274.162 | 3 537 | 2 213 | 1 324 | 12.9 | 8.1 | 4.8 | 13.0 | 1.57 |
| 2008 | 274.848 | 3 546 | 2 480 | 1 066 | 12.9 | 9.0 | 3.9 | 18.3 | 1.57 |
| 2009 | 275.441 | 3 551 | 2 419 | 1 132 | 12.9 | 8.8 | 4.1 | 8.7 | 1.57 |
| 2010 | 277.758 | 3 366 | 2 195 | 1 171 | 12.2 | 8.0 | 4.2 | 10.1 | 1.54 |
| 2011 | 277.662 | 3 283 | 2 421 | 862 | 11.8 | 8.8 | 3.0 | 13.7 | 1.53 |
| 2012 | 277.668 | 3 185 | 2 403 | 782 | 11.5 | 8.7 | 2.8 | 11.0 | 1.51 |
| 2013 | 277.492 | 3 020 | 2 276 | 744 | 10.9 | 8.2 | 2.7 | 1.49 | |
| 2014 | 277.199 | 2 902 | 2 580 | 322 | 10.5 | 9.3 | 1.2 | 10.0 | 1.47 |
| 2015 | 274.633 | 2 552 | 9.5 | 1.41 | |||||
| 2016 | |||||||||
| 2017 | 2 346 |
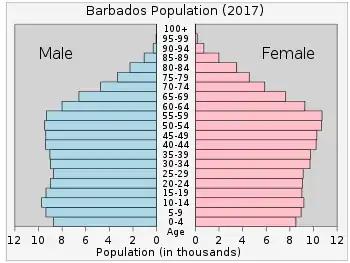
Structure of the population
Structure of the population (01.05.2010) (Census) :
| Age Group | Male | Female | Total | % |
|---|---|---|---|---|
| Total | 133 018 | 144 803 | 277 821 | 100 |
| 0-4 | 8 873 | 8 479 | 17 352 | 6,25 |
| 5-9 | 9 683 | 9 155 | 18 838 | 6,78 |
| 10-14 | 9 445 | 9 122 | 18 567 | 6,68 |
| 15-19 | 9 452 | 9 418 | 18 870 | 6,79 |
| 20-24 | 9 061 | 9 108 | 18 169 | 6,54 |
| 25-29 | 9 313 | 9 775 | 19 088 | 6,87 |
| 30-34 | 9 150 | 9 635 | 18 785 | 6,76 |
| 35-39 | 9 884 | 10 632 | 20 516 | 7,38 |
| 40-44 | 9 663 | 10 450 | 20 113 | 7,24 |
| 45-49 | 10 062 | 11 303 | 21 365 | 7,69 |
| 50-54 | 9 411 | 10 639 | 20 050 | 7,22 |
| 55-59 | 7 871 | 8 782 | 16 653 | 5,99 |
| 60-64 | 6 326 | 7 160 | 13 486 | 4,85 |
| 65-69 | 4 511 | 5 640 | 10 151 | 3,65 |
| 70-74 | 3 804 | 4 876 | 8 680 | 3,12 |
| 75-79 | 2 863 | 4 074 | 6 937 | 2,50 |
| 80-84 | 1 986 | 3 167 | 5 153 | 1,85 |
| 85+ | 1 660 | 3 388 | 5 048 | 1,82 |
| Age group | Male | Female | Total | Percent |
|---|---|---|---|---|
| 0-14 | 28 001 | 26 756 | 54 757 | 19,71 |
| 15-64 | 90 193 | 96 902 | 187 095 | 67,34 |
| 65+ | 14 824 | 21 145 | 35 969 | 12,95 |
Other demographics statistics
Demographic statistics according to the World Population Review in 2019.[10]
- One birth every 180 minutes
- One death every 206 minutes
- One net migrant every Infinity minutes
- Net gain of one person every 1440 minutes
Demographic statistics according to the CIA World Factbook, unless otherwise indicated.[11]
- Nationality
- noun: Barbadian(s) or Bajan (colloquial)
- adjective: Barbadian or Bajan (colloquial)
- Population
- 293,131 (July 2018 est.)
- Ethnic groups
- African descent 92.4%, mixed 3.1%, white 2.7%, East Indian 1.3%, other 0.2%, unspecified 0.3% (2010 est.)
- Age structure
- 0-14 years: 17.8% (male 26,084 /female 26,090)
- 15-24 years: 12.53% (male 18,236 /female 18,479)
- 25-54 years: 43.69% (male 63,829 /female 64,249)
- 55-64 years: 13.62% (male 18,888 /female 21,043)
- 65 years and over: 12.36% (male 14,705 /female 21,528) (2018 est.)
- Median age
- total: 38.9 years. Country comparison to the world: 56th
- male: 37.8 years
- female: 40.1 years (2018 est.)
- Birth rate
- 11.6 births/1,000 population (2018 est.) Country comparison to the world: 169th
- Death rate
- 8.6 deaths/1,000 population (2018 est.) Country comparison to the world: 73rd
- Total fertility rate
- 1.68 children born/woman (2018 est.) Country comparison to the world: 175th
- Net migration rate
- -0.3 migrant(s)/1,000 population (2018 est.) Country comparison to the world: 114th
- Population growth rate
- 0.26% (2018 est.) Country comparison to the world: 176th
- Contraceptive prevalence rate
- 59.2% (2012)
- Languages
English (official), Bajan (English-based creole language, widely spoken in informal settings)
- Religions
Protestant 66.4% (includes Anglican 23.9%, other Pentecostal 19.5%, Adventist 5.9%, Methodist 4.2%, Wesleyan 3.4%, Nazarene 3.2%, Church of God 2.4%, Baptist 1.8%, Moravian 1.2%, other Protestant 0.9%), Roman Catholic 3.8%, other Christian 5.4% (includes Jehovah's Witness 2.0%, other 3.4%), Rastafarian 1%, other 1.5%, none 20.6%, unspecified 1.2% (2010 est.)
- Population distribution
most densely populated country in the eastern Caribbean; approximately one-third live in urban areas
- Life expectancy at birth
- total population: 75.7 years
- male: 73.3 years
- female: 78.1 years (2018 est.)
- Dependency ratios
- total dependency ratio: 50.4 (2015 est.)
- youth dependency ratio: 29.1 (2015 est.)
- elderly dependency ratio: 21.3 (2015 est.)
- potential support ratio: 4.7 (2015 est.)
- Urbanization
- urban population: 31.1% of total population (2018)
- rate of urbanization: 0.2% annual rate of change (2015-20 est.)
- Obesity - adult prevalence rate
- 23.1% (2016). Country comparison to the world: 67th
- Literacy
definition: age 15 and over can read and write (2014 est.)
- total population: 99.6%
- male: 99%
- female: 99.6% (2014)
- School life expectancy (primary to tertiary education)
- total: 15 years
- male: 14 years
- female: 17 years (2011)
- Unemployment, youth ages 15–24
- total: 29.6%. Country comparison to the world: 32nd
- male: 27.9%
- female: 31.5% (2016 est.)
References
- "2010 POPULATION AND HOUSING CENSUS" (PDF). Barstats.gov.bb. Archived from the original (PDF) on 18 January 2017. Retrieved 30 August 2017.
- ""World Population prospects – Population division"". population.un.org. United Nations Department of Economic and Social Affairs, Population Division. Retrieved November 9, 2019.
- ""Overall total population" – World Population Prospects: The 2019 Revision" (xslx). population.un.org (custom data acquired via website). United Nations Department of Economic and Social Affairs, Population Division. Retrieved November 9, 2019.
- "Barbados". Ethnologue.com. Retrieved 30 August 2017.
- Melton, J. Gordon; Baumann, Martin (21 September 2010). Religions of the World: A Comprehensive Encyclopedia of Beliefs and Practices, 2nd Edition [6 volumes]: A Comprehensive Encyclopedia of Beliefs and Practices. ABC-CLIO. ISBN 9781598842043. Retrieved 30 August 2017 – via Google Books.
- "2000 ROUND OF POPULATION AND HOUSING CENSUS SUB-PROJECT : NATIONAL CENSUS REPORT BARBADOS" (PDF). Caricomstats.org. Archived from the original (PDF) on 5 February 2018. Retrieved 30 August 2017.
- "United Nations : Demographic Yearbooks". Unstats.un.org. Retrieved 30 August 2017.
- "DEMOGRAPHIC PROFILE: BARBADOS" (PDF). Caricomstats.org. Retrieved 30 August 2017.
- "United Nations Statistics Division - Demographic and Social Statistics". Unstats.un.org. Retrieved 30 August 2017.
- "Barbados Population 2019", World Population Review
- "World Factbook CENTRAL AMERICA : BARBADOS", The World Factbook, July 12, 2018
 This article incorporates text from this source, which is in the public domain.
External links
- Barbados profile - The Commonwealth of Nations