Demographics of Greenland
This article is about the demographic features of the population of Greenland, including population density, ethnicity, economic status, religious affiliations and other aspects of the population.
Populations
On 1 July 2014, Greenland had 56,295 inhabitants. This represents an increase of 13 over 1 January but a decrease of 188 over 1 July 2013.[1] The decrease in Greenland's population is due to emigration, as natural growth is positive.
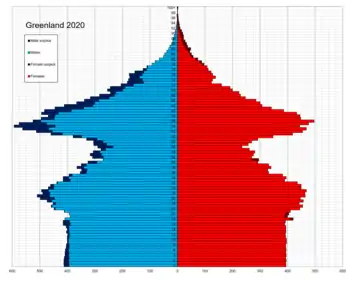
Age structure
0–6 years: 5,605 (male 2,893 ; female 2,712)
7–14 years: 6,531 (male 3,316 ; female 3,215)
15–17 years: 2,462 (male 1,243 ; female 1,219)
18–24 years: 6,491 (male 3,293 ; female 3,198)
25–64 years: 31,128 (male 16,960 ; female 14,168)
65- years: 4,153 (male 2,133 ; female 2,020)[2]
Vital statistics[3][4]
| Year | Average population | Live births | Deaths | Natural change | Crude birth rate (per 1000) | Crude death rate (per 1000) | Natural change (per 1000) | Total fertility rate | Infant mortality rate |
|---|---|---|---|---|---|---|---|---|---|
| 1900 | 12,000 | 416 | 306 | 110 | 35.6 | 26.2 | 9.4 | ||
| 1901 | 12,000 | 461 | 301 | 160 | 38.7 | 25.3 | 13.4 | ||
| 1902 | 12,000 | 426 | 259 | 167 | 35.5 | 21.6 | 13.9 | ||
| 1903 | 12,000 | 428 | 327 | 101 | 35.1 | 26.8 | 8.3 | ||
| 1904 | 12,000 | 535 | 283 | 252 | 43.5 | 23.0 | 20.5 | ||
| 1905 | 13,000 | 487 | 292 | 195 | 39.0 | 23.4 | 15.6 | ||
| 1906 | 13,000 | 493 | 366 | 127 | 39.1 | 29.0 | 10.1 | ||
| 1907 | 13,000 | 476 | 362 | 114 | 37.2 | 28.3 | 8.9 | ||
| 1908 | 13,000 | 543 | 378 | 165 | 42.1 | 29.3 | 12.8 | ||
| 1909 | 13,000 | 564 | 448 | 116 | 43.1 | 34.2 | 8.9 | ||
| 1910 | 13,000 | 443 | 354 | 89 | 33.6 | 26.8 | 6.7 | ||
| 1911 | 13,000 | 577 | 562 | 15 | 43.1 | 41.9 | 1.1 | ||
| 1912 | 14,000 | 482 | 389 | 93 | 35.7 | 28.8 | 6.9 | ||
| 1913 | 14,000 | 592 | 390 | 202 | 43.5 | 28.7 | 14.9 | ||
| 1914 | 14,000 | 531 | 458 | 73 | 38.8 | 33.4 | 5.3 | ||
| 1915 | 14,000 | 545 | 428 | 117 | 39.8 | 31.2 | 8.5 | ||
| 1916 | 14,000 | 545 | 447 | 98 | 39.5 | 32.4 | 7.1 | ||
| 1917 | 14,000 | 547 | 312 | 235 | 39.4 | 22.4 | 16.9 | ||
| 1918 | 14,000 | 550 | 328 | 222 | 39.3 | 23.4 | 15.9 | ||
| 1919 | 14,000 | 510 | 614 | -104 | 36.2 | 43.5 | -7.4 | ||
| 1920 | 14,000 | 569 | 429 | 140 | 40.1 | 30.2 | 9.9 | ||
| 1921 | 14,000 | 610 | 565 | 45 | 42.7 | 39.5 | 3.1 | ||
| 1922 | 15,000 | 545 | 396 | 149 | 37.3 | 27.1 | 10.2 | ||
| 1923 | 15,000 | 563 | 326 | 237 | 38.0 | 22.0 | 16.0 | ||
| 1924 | 15,000 | 580 | 426 | 154 | 38.4 | 28.2 | 10.2 | ||
| 1925 | 15,000 | 660 | 582 | 78 | 42.9 | 37.8 | 5.1 | ||
| 1926 | 16,000 | 619 | 340 | 279 | 39.7 | 21.8 | 17.9 | ||
| 1927 | 16,000 | 615 | 322 | 293 | 38.7 | 20.3 | 18.4 | ||
| 1928 | 16,000 | 680 | 366 | 314 | 42.0 | 22.6 | 19.4 | ||
| 1929 | 17,000 | 743 | 353 | 390 | 45.0 | 21.4 | 23.6 | ||
| 1930 | 17,000 | 768 | 383 | 385 | 45.7 | 22.8 | 22.9 | ||
| 1931 | 17,000 | 779 | 431 | 348 | 46.1 | 25.5 | 20.6 | ||
| 1932 | 17,000 | 728 | 625 | 103 | 43.3 | 37.1 | 6.2 | ||
| 1933 | 17,000 | 776 | 370 | 406 | 45.6 | 21.8 | 23.8 | ||
| 1934 | 17,000 | 807 | 503 | 304 | 46.4 | 28.9 | 17.5 | ||
| 1935 | 18,000 | 813 | 835 | -22 | 46.5 | 47.7 | -1.3 | ||
| 1936 | 18,000 | 740 | 811 | -71 | 42.0 | 46.1 | -4.0 | ||
| 1937 | 18,000 | 767 | 474 | 293 | 43.1 | 26.6 | 16.5 | ||
| 1938 | 18,000 | 731 | 375 | 356 | 40.4 | 20.7 | 19.7 | ||
| 1939 | 18,000 | 762 | 680 | 82 | 41.6 | 37.2 | 4.5 | ||
| 1940 | 19,000 | 873 | 356 | 517 | 46.9 | 19.1 | 27.8 | ||
| 1941 | 19,000 | 815 | 364 | 451 | 42.7 | 19.1 | 23.6 | ||
| 1942 | 20,000 | 904 | 448 | 456 | 46.1 | 22.9 | 23.3 | ||
| 1943 | 20,000 | 796 | 429 | 367 | 39.8 | 21.5 | 18.4 | ||
| 1944 | 20,000 | 911 | 491 | 420 | 44.7 | 24.1 | 20.6 | ||
| 1945 | 21,000 | 818 | 408 | 410 | 39.5 | 19.7 | 19.8 | ||
| 1946 | 21,000 | 920 | 416 | 504 | 43.6 | 19.7 | 23.9 | ||
| 1947 | 22,000 | 953 | 490 | 463 | 44.1 | 22.7 | 21.4 | ||
| 1948 | 22,000 | 883 | 499 | 384 | 40.5 | 22.9 | 17.6 | ||
| 1949 | 22,000 | 989 | 898 | 91 | 44.7 | 40.6 | 4.1 | ||
| 1950 | 23,000 | 1,129 | 539 | 590 | 50.0 | 23.8 | 26.1 | ||
| 1951 | 23,000 | 999 | 550 | 449 | 42.9 | 23.6 | 19.3 | ||
| 1952 | 24,000 | 1,034 | 475 | 559 | 43.1 | 19.8 | 23.3 | ||
| 1953 | 25,000 | 1,109 | 398 | 711 | 44.9 | 16.1 | 28.8 | ||
| 1954 | 26,000 | 1,136 | 388 | 748 | 44.4 | 15.2 | 29.2 | ||
| 1955 | 27,000 | 1,234 | 375 | 859 | 46.4 | 14.1 | 32.3 | ||
| 1956 | 27,000 | 1,293 | 351 | 942 | 47.2 | 12.8 | 34.4 | ||
| 1957 | 29,000 | 1,361 | 337 | 1,024 | 47.6 | 11.8 | 35.8 | ||
| 1958 | 30,000 | 1,410 | 290 | 1,120 | 47.2 | 9.7 | 37.5 | ||
| 1959 | 31,000 | 1,491 | 285 | 1,206 | 47.6 | 9.1 | 38.5 | ||
| 1960 | 33,000 | 1,586 | 256 | 1,330 | 48.6 | 7.8 | 40.7 | ||
| 1961 | 34,000 | 1,644 | 292 | 1,352 | 48.8 | 8.7 | 40.1 | ||
| 1962 | 35,000 | 1,610 | 361 | 1,249 | 46.1 | 10.3 | 35.8 | ||
| 1963 | 36,000 | 1,671 | 279 | 1,392 | 46.2 | 7.7 | 38.5 | ||
| 1964 | 38,000 | 1,797 | 329 | 1,468 | 47.4 | 8.7 | 38.7 | ||
| 1965 | 39,000 | 1,738 | 337 | 1,401 | 44.3 | 8.6 | 35.7 | ||
| 1966 | 41,000 | 1,781 | 329 | 1,452 | 43.5 | 8.0 | 35.5 | ||
| 1967 | 43,000 | 1,685 | 314 | 1,371 | 39.3 | 7.3 | 32.0 | ||
| 1968 | 45,000 | 1,576 | 333 | 1,243 | 35.3 | 7.4 | 27.8 | ||
| 1969 | 46,000 | 1,310 | 311 | 999 | 28.5 | 6.8 | 21.7 | ||
| 1970 | 46,000 | 1,144 | 283 | 861 | 24.7 | 6.1 | 18.6 | 2.66 | |
| 1971 | 47,000 | 1,028 | 289 | 739 | 21.8 | 6.1 | 15.7 | ||
| 1972 | 48,000 | 948 | 295 | 653 | 19.6 | 6.1 | 13.5 | ||
| 1973 | 49,000 | 940 | 339 | 601 | 19.2 | 6.9 | 12.3 | ||
| 1974 | 50,000 | 866 | 332 | 534 | 17.5 | 6.7 | 10.8 | ||
| 1975 | 50,000 | 815 | 313 | 502 | 17.5 | 6.3 | 11.2 | 2.26 | |
| 1976 | 50,000 | 859 | 348 | 511 | 17.3 | 7.0 | 10.3 | ||
| 1977 | 49,000 | 918 | 373 | 545 | 18.6 | 7.2 | 11.4 | 2.359 | |
| 1978 | 49,000 | 870 | 309 | 561 | 17.7 | 6.4 | 11.3 | 2.209 | |
| 1979 | 50,000 | 900 | 393 | 507 | 18.2 | 8.1 | 10.0 | 2.201 | |
| 1980 | 50,000 | 1,034 | 380 | 654 | 20.5 | 7.6 | 12.8 | 2.449 | |
| 1981 | 51,000 | 1,056 | 381 | 675 | 20.6 | 7.5 | 13.1 | 2.346 | |
| 1982 | 52,000 | 1,052 | 408 | 644 | 20.6 | 8.2 | 12.4 | 2.252 | |
| 1983 | 52,000 | 994 | 433 | 561 | 18.9 | 8.3 | 10.6 | 2.067 | |
| 1984 | 53,000 | 1,054 | 439 | 615 | 20.0 | 8.3 | 11.7 | 2.119 | |
| 1985 | 53,000 | 1,152 | 435 | 717 | 21.4 | 8.2 | 13.2 | 2.253 | |
| 1986 | 54,000 | 1,055 | 445 | 610 | 19.7 | 8.3 | 11.4 | 2.052 | |
| 1987 | 54,000 | 1,104 | 445 | 659 | 20.4 | 8.2 | 12.2 | 2.090 | |
| 1988 | 55,000 | 1,213 | 432 | 781 | 22.1 | 7.9 | 14.3 | 2.323 | |
| 1989 | 55,000 | 1,210 | 455 | 755 | 21.9 | 8.2 | 13.7 | 2.309 | |
| 1990 | 56,000 | 1,258 | 467 | 791 | 22.6 | 8.4 | 14.2 | 2.453 | 34.8 |
| 1991 | 56,000 | 1,192 | 458 | 734 | 21.5 | 8.3 | 13.2 | 2.430 | 34.7 |
| 1992 | 55,000 | 1,237 | 441 | 796 | 22.4 | 8.0 | 14.4 | 2.616 | 14.7 |
| 1993 | 55,000 | 1,180 | 432 | 748 | 21.3 | 7.8 | 13.5 | 2.584 | 27.7 |
| 1994 | 56,000 | 1,139 | 445 | 694 | 20.5 | 8.0 | 12.5 | 2.534 | 24.0 |
| 1995 | 56,000 | 1,101 | 480 | 621 | 19.7 | 8.6 | 11.1 | 2.518 | 21.2 |
| 1996 | 56,000 | 1,051 | 444 | 607 | 18.8 | 8.0 | 10.9 | 2.502 | 23.0 |
| 1997 | 56,000 | 1,095 | 492 | 603 | 19.6 | 8.8 | 10.8 | 2.697 | 19.2 |
| 1998 | 56,000 | 980 | 457 | 523 | 17.5 | 8.1 | 9.3 | 2.458 | 20.0 |
| 1999 | 56,000 | 945 | 479 | 466 | 16.8 | 8.5 | 8.3 | 2.419 | 17.7 |
| 2000 | 56,000 | 879 | 450 | 429 | 15.6 | 8.0 | 7.6 | 2.333 | 19.0 |
| 2001 | 56,000 | 942 | 466 | 476 | 16.7 | 8.3 | 8.4 | 2.513 | 12.2 |
| 2002 | 57,000 | 954 | 446 | 508 | 16.9 | 7.9 | 9.0 | 2.570 | 15.3 |
| 2003 | 57,000 | 879 | 411 | 468 | 15.5 | 7.2 | 8.2 | 2.378 | 8.4 |
| 2004 | 57,000 | 892 | 479 | 413 | 15.7 | 8.4 | 7.3 | 2.421 | 15.0 |
| 2005 | 57,000 | 886 | 465 | 421 | 15.6 | 8.2 | 7.4 | 2.380 | 9.7 |
| 2006 | 57,000 | 842 | 440 | 402 | 14.8 | 7.7 | 7.1 | 2.258 | 16.7 |
| 2007 | 57,000 | 853 | 452 | 401 | 15.1 | 8.0 | 7.1 | 2.302 | 11.0 |
| 2008 | 56,000 | 834 | 428 | 406 | 14.8 | 7.6 | 7.2 | 2.253 | 9.9 |
| 2009 | 56,000 | 895 | 437 | 458 | 15.9 | 7.8 | 8.1 | 2.364 | 4.8 |
| 2010 | 56,000 | 869 | 504 | 365 | 15.4 | 8.9 | 6.5 | 2.257 | 8.1 |
| 2011 | 57,000 | 821 | 476 | 345 | 14.5 | 8.4 | 6.1 | 2.099 | 10.9 |
| 2012 | 57,000 | 786 | 459 | 327 | 13.8 | 8.1 | 5.8 | 1.972 | 9.0 |
| 2013 | 56,000 | 820 | 444 | 376 | 14.5 | 7.9 | 6.7 | 2.040 | |
| 2014 | 56,000 | 805 | 461 | 344 | 14.3 | 8.2 | 6.1 | 1.991 | |
| 2015 | 56,000 | 854 | 472 | 382 | 15.2 | 8.4 | 6.8 | 2.112 | |
| 2016 | 56,000 | 830 | 487 | 343 | 14.8 | 8.7 | 6.1 | 2.047 | |
| 2017 | 56,000 | 853 | 499 | 354 | 15.2 | 8.9 | 6.3 | 2.096 | |
| 2018 | 56,000 | 819 | 487 | 332 | 14.7 | 8.7 | 6.0 | 1.997 | |
| 2019 | 56,000 | 849 | 548 | 301 | 15.1 | 9.7 | 5.4 | 2.054 | |
| 2020 | 56,000 |
Structure of the population [5]
Structure of the population (01.07.2013) (Estimates - Population statistics are compiled from registers) :
| Age Group | Male | Female | Total | % |
|---|---|---|---|---|
| Total | 29 867 | 26 616 | 56 483 | 100 |
| 0-4 | 2 142 | 1 930 | 4 072 | 7.21 |
| 5-9 | 2 004 | 1 942 | 3 946 | 6.99 |
| 10-14 | 2 088 | 2 022 | 4 110 | 7.28 |
| 15-19 | 2 130 | 2 111 | 4 241 | 7.51 |
| 20-24 | 2 350 | 2 283 | 4 633 | 8.20 |
| 25-29 | 2 159 | 2 081 | 4 240 | 7.51 |
| 30-34 | 1 954 | 1 864 | 3 818 | 6.76 |
| 35-39 | 1 730 | 1 440 | 3 170 | 5.61 |
| 40-44 | 2 008 | 1 690 | 3 698 | 6.55 |
| 45-49 | 2 980 | 2 537 | 5 517 | 9.77 |
| 50-54 | 2 599 | 2 123 | 4 722 | 8.36 |
| 55-59 | 2 092 | 1 546 | 3 638 | 6.44 |
| 60-64 | 1 425 | 1 036 | 2 461 | 4.36 |
| 65-69 | 1 071 | 731 | 1 802 | 3.19 |
| 70-74 | 629 | 594 | 1 223 | 2.17 |
| 75-79 | 319 | 365 | 684 | 1.21 |
| 80-84 | 143 | 229 | 372 | 0.66 |
| 85-89 | 39 | 80 | 119 | 0.21 |
| 90-94 | 4 | 10 | 14 | 0.02 |
| 95-99 | 1 | 2 | 3 | <0.01 |
| Age group | Male | Female | Total | Percent |
|---|---|---|---|---|
| 0-14 | 6 234 | 5 894 | 12 128 | 21.47 |
| 15-64 | 21 427 | 18 711 | 40 138 | 71.06 |
| 65+ | 2 206 | 2 011 | 4 217 | 7.47 |
Life expectancy at birth
total population:
71.25 years
male:
68.6 years
female:
74.04 years (2012 est.)
Ethnic groups
| Significant minority groups[7] | |
| Nationality | Population (2020) |
|---|---|
| 373 | |
| 208 | |
| 128 | |
| 74 | |
| 61 | |
| 53 | |
| 50 | |
| 47 | |
| 39 | |
| 20 | |
The population of Greenland consists of Greenlandic Inuit (including mixed-race persons), Danish Greenlanders and other Europeans and North Americans. The Inuit population makes up approximately 85%-90% of the total (2009 est.). 6,792 people from Denmark live in Greenland, which is 12% of its total population.
In recent years, Greenland experienced a significant increase in immigration from Asia, especially from the Philippines, Thailand, and China.
Languages
The only official language of Greenland is Greenlandic.[8] The number of speakers of Greenlandic is estimated at 50,000 (85-90% of the total population), divided in three main dialects, Kalaallisut (West-Greenlandic, 44,000 speakers and the dialect that is used as official language), Tunumiit (East-Greenlandic, 3,000 speakers) and Inuktun (North-Greenlandic, 800 speakers). The remainder of the population mainly speaks Danish; Inuit Sign Language is the language of the deaf community.
Religion
The nomadic Inuit people were traditionally shamanistic, with a well-developed mythology primarily concerned with propitiating a vengeful and fingerless sea goddess who controlled the success of the seal and whale hunts.
The first Norse colonists were pagan, but Erik the Red's son Leif was converted to Catholic Christianity by King Olaf Trygvesson on a trip to Norway in 990 and sent missionaries back to Greenland. These swiftly established sixteen parishes, some monasteries, and a bishopric at Garðar.
Rediscovering these colonists and spreading the Protestant Reformation among them was one of the primary reasons for the Danish recolonization in the 18th century. Under the patronage of the Royal Mission College in Copenhagen, Norwegian and Danish Lutherans and German Moravian missionaries searched for the missing Norse settlements and began converting the Inuit. The principal figures in the Christianization of Greenland were Hans and Poul Egede and Matthias Stach. The New Testament was translated piecemeal from the time of the very first settlement on Kangeq Island, but the first translation of the whole Bible was not completed until 1900. An improved translation using the modern orthography was completed in 2000.[9]
Today, the major religion is Protestant Christianity, mostly members of the Lutheran Church of Denmark. While there is no official census data on religion in Greenland, the Lutheran Bishop of Greenland Sofie Petersen[10] estimates that 85% of the Greenlandic population are members of its congregation.[11]
See also
References
- http://www.stat.gl/dialog/main.asp?lang=en&version=201403
- http://www.stat.gl/publ/en/GF/2013/pdf/Greenland%20in%20Figures%202013.pdf
- United nations. Demographic Yearbooks
- Statistics Greenland
- http://unstats.un.org/unsd/demographic/products/dyb/dyb2.htm
- "North America :: GREENLAND". CIA The World Factbook.
- http://bank.stat.gl/pxweb/en/Greenland/Greenland__BE__BE01__BE0120/BEXST6.px/table/tableViewLayout1/?rxid=BEXST618-05-2020%2005:26:26
- Ethnolgue
- Leif Kiil Sørensen (29 November 2000). "Grønlandsk bibel præsenteret | Kristeligt Dagblad". Kristeligt-dagblad.dk. Retrieved 6 September 2010.
- "Bells ring a wake-up call for climate justice." Archived 2012-03-25 at the Wayback Machine World Council of Churches. 14 December 2010. Retrieved 30 August 2010
- "Grønland, Grundloven og Gejstligheden" (PDF). Archived from the original (PDF) on 25 April 2012. Retrieved 30 April 2012.
| |||||||
| History |  | ||||||
| Geography |
| ||||||
| Politics | |||||||
| Economy | |||||||
| Society |
| ||||||