Dumfries (Scottish Parliament constituency)
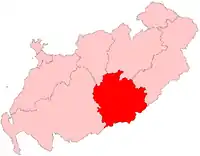
Dumfries was a constituency of the Scottish Parliament (Holyrood). It elected one Member of the Scottish Parliament (MSP) by the plurality (first past the post) method of election. It was also one of nine constituencies in the South of Scotland electoral region, which elects seven additional members, in addition to the nine constituency MSPs, to produce a form of proportional representation for the region as a whole.
| Dumfries | |
|---|---|
| Former county constituency for the Scottish Parliament | |
 | |
.svg.png.webp) Dumfries shown within the South of Scotland electoral region and the region shown within Scotland | |
| Former constituency | |
| Created | 1999 |
| Abolished | 2011 |
| Council area | Dumfries and Galloway |
| Replaced by | Dumfriesshire, Galloway and West Dumfries |
From the Scottish Parliament election, 2011, the Dumfries constituency was abolished, with the city being divided between two new constituencies; Dumfriesshire, and Galloway and West Dumfries.
Electoral region
Constituency boundaries and council area
The Dumfries constituency was created at the same time as the Scottish Parliament, in 1999, with the name and boundaries of an existing Westminster constituency. In 2005, however, Scottish Westminster constituencies were mostly replaced with new constituencies.[1]
Member of the Scottish Parliament
| Election | Member | Party | ||
|---|---|---|---|---|
| 1999 | Elaine Murray | Labour | ||
| 2011 | Constituency abolished: see Dumfriesshire and Galloway and West Dumfries | |||
Election results
| Party | Candidate | Votes | % | ±% | |
|---|---|---|---|---|---|
| Labour | Elaine Murray | 13,707 | 41.0 | +1.0 | |
| Conservative | Murray Tosh | 10,860 | 32.5 | -4.1 | |
| SNP | Michael Russell | 6,306 | 18.9 | +6.7 | |
| Liberal Democrats | Lynne Hume | 2,538 | 7.6 | +0.1 | |
| Majority | 2,839 | 8.5 | +5.1 | ||
| Rejected ballots | 1,006 | ||||
| Turnout | 33,419 | 53.5 | +1.3 | ||
| Labour hold | Swing | +2.6 | |||
| Party | Candidate | Votes | % | ±% | |
|---|---|---|---|---|---|
| Labour | Elaine Murray | 12,834 | 40.0 | +3.2 | |
| Conservative | David Mundell | 11,738 | 36.6 | +9.3 | |
| SNP | Andrew Wood | 3,931 | 12.3 | -7.6 | |
| Liberal Democrats | Clare Humblen | 2394 | 7.5 | -8.7 | |
| Scottish Socialist | John Dennis | 1213 | 3.8 | N/A | |
| Majority | 1,096 | 3.4 | -6.1 | ||
| Turnout | 32,110 | ||||
| Labour hold | Swing | ||||
| Party | Candidate | Votes | % | ±% | |
|---|---|---|---|---|---|
| Labour | Elaine Murray | 14,101 | 36.7 | N/A | |
| Conservative | David Mundell | 10,447 | 27.2 | N/A | |
| SNP | Stephen Norris | 7,625 | 19.8 | N/A | |
| Liberal Democrats | Iain Haughie | 6,209 | 16.2 | N/A | |
| Majority | 3,654 | 10.5 | N/A | ||
| Turnout | 38,382 | N/A | |||
| Labour win (new seat) | |||||
Footnotes
- See The 5th Periodical Report of the Boundary Commission for Scotland Archived September 21, 2007, at the Wayback Machine