Eastleigh Borough Council elections
One third of Eastleigh Borough Council is elected each year, followed by one year without election.
Political control
| Election | Overall control | Lib Dem | Conservative | Labour | Ind. |
|---|---|---|---|---|---|
| 1973 | No Overall Control | 29 | 7 | 8 | - |
| 1976 | Conservative | 1 | 36 | 6 | 1 |
| 1978 | Conservative | 1 | 37 | 4 | 1 |
| 1979 | Conservative | 2 | 34 | 7 | 1 |
| 1980 | Conservative | 4 | 31 | 9 | - |
| 1982 | Conservative | 8 | 25 | 11 | - |
| 1983 | No Overall Control | 11 | 22 | 11 | - |
| 1984 | No Overall Control | 14 | 20 | 10 | - |
| 1986 | No Overall Control | 19 | 16 | 9 | - |
| 1987 | No Overall Control | 21 | 15 | 8 | - |
| 1988 | Social and Liberal Democrats | 23 | 15 | 6 | - |
| 1990 | No Overall Control | 22 | 16 | 6 | - |
| 1991 | No Overall Control | 20 | 17 | 7 | - |
| 1992 | No Overall Control | 19 | 19 | 6 | - |
| 1994 | No Overall Control | 22 | 18 | 4 | - |
| 1995 | Liberal Democrats | 27 | 13 | 4 | - |
| 1996 | Liberal Democrats | 31 | 7 | 6 | - |
| 1998 | Liberal Democrats | 29 | 7 | 8 | - |
| 1999 | Liberal Democrats | 29 | 7 | 8 | - |
| 2000 | Liberal Democrats | 28 | 9 | 7 | - |
| 2002 | Liberal Democrats | 31 | 9 | 4 | - |
| 2003 | Liberal Democrats | 30 | 10 | 4 | - |
| 2004 | Liberal Democrats | 32 | 9 | 3 | - |
| 2006 | Liberal Democrats | 34 | 7 | 3 | - |
| 2007 | Liberal Democrats | 37 | 5 | 2 | - |
| 2008 | Liberal Democrats | 38 | 4 | 2 | - |
| 2010 | Liberal Democrats | 39 | 4 | 1 | - |
| 2011 | Liberal Democrats | 38 | 4 | 0 | 2 |
| 2012 | Liberal Democrats | 40 | 4 | 0 | 0 |
| 2014 | Liberal Democrats | 40 | 4 | 0 | 0 |
| 2015 | Liberal Democrats | 38 | 6 | 0 | 0 |
| 2016 | Liberal Democrats | 38 | 6 | 0 | 0 |
| 2018 | Liberal Democrats | 32 | 4 | 0 | 3 |
| 2019 | Liberal Democrats | 34 | 2 | 0 | 3 |
Council elections
- 1973 Eastleigh Borough Council election
- 1976 Eastleigh Borough Council election (New ward boundaries)[1]
- 1979 Eastleigh Borough Council election
- 1980 Eastleigh Borough Council election
- 1982 Eastleigh Borough Council election
- 1983 Eastleigh Borough Council election
- 1984 Eastleigh Borough Council election
- 1986 Eastleigh Borough Council election (Borough boundary changes took place but the number of seats remained the same)[2]
- 1987 Eastleigh Borough Council election
- 1988 Eastleigh Borough Council election
- 1990 Eastleigh Borough Council election
- 1991 Eastleigh Borough Council election
- 1992 Eastleigh Borough Council election
- 1994 Eastleigh Borough Council election
- 1995 Eastleigh Borough Council election
- 1996 Eastleigh Borough Council election
- 1998 Eastleigh Borough Council election
- 1999 Eastleigh Borough Council election
- 2000 Eastleigh Borough Council election
- 2002 Eastleigh Borough Council election (New ward boundaries)[3]
- 2003 Eastleigh Borough Council election
- 2004 Eastleigh Borough Council election
- 2006 Eastleigh Borough Council election
- 2007 Eastleigh Borough Council election
- 2008 Eastleigh Borough Council election
- 2010 Eastleigh Borough Council election
- 2011 Eastleigh Borough Council election
- 2012 Eastleigh Borough Council election
- 2014 Eastleigh Borough Council election
- 2015 Eastleigh Borough Council election
- 2016 Eastleigh Borough Council election
- 2018 Eastleigh Borough Council election (New ward boundaries)
- 2019 Eastleigh Borough Council election
- 2021 Eastleigh Borough Council election
District result maps
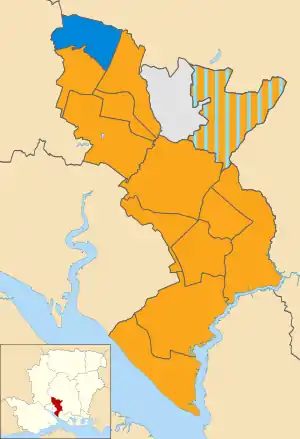 2018 results map
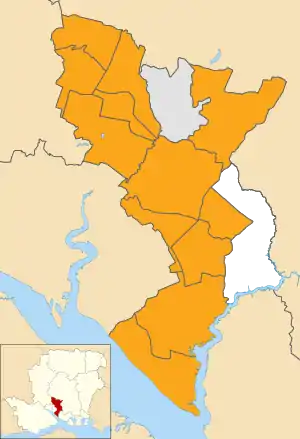 2019 results map
By-election results
| Party | Candidate | Votes | % | ±% | |
|---|---|---|---|---|---|
| Labour | 1,050 | 41.6 | |||
| Liberal Democrats | 1,012 | 40.2 | -20.7 | ||
| Conservative | 458 | 18.2 | |||
| Majority | 38 | 1.4 | |||
| Turnout | 2,520 | 35.0 | |||
| Labour gain from Liberal Democrats | Swing | ||||
| Party | Candidate | Votes | % | ±% | |
|---|---|---|---|---|---|
| Liberal Democrats | Nicholas Couldrey | 828 | 46.0 | +6.8 | |
| Conservative | Steven Broomfield | 553 | 30.7 | +3.7 | |
| UKIP | George McGuinness | 286 | 15.9 | -6.5 | |
| Labour | John Sorley | 132 | 7.3 | -4.1 | |
| Majority | 275 | 15.3 | |||
| Turnout | 1,808 | 26.6 | |||
| Liberal Democrats hold | Swing | ||||
| Party | Candidate | Votes | % | ±% | |
|---|---|---|---|---|---|
| Liberal Democrats | Clifford Morris | 669 | 56.5 | +15.5 | |
| Conservative | Joyce Haythorne | 316 | 26.7 | -10.9 | |
| Labour | Keith Day | 144 | 12.2 | +0.9 | |
| Green | Rosanna Campbell | 41 | 3.5 | N/A | |
| UKIP | Peter House | 14 | 1.2 | -9.0 | |
| Majority | 353 | 29.8 | |||
| Turnout | 1,185 | 20.05 | |||
| Liberal Democrats hold | Swing | +26.4 | |||
References
- The Borough of Eastleigh (Electoral Arrangements) Order 1975
- The Hampshire (Areas) Order 1985
- legislation.gov.uk - The Borough of Eastleigh (Parishes and Electoral Changes) Order 2001. Retrieved on 4 October 2015.
External links
This article is issued from Wikipedia. The text is licensed under Creative Commons - Attribution - Sharealike. Additional terms may apply for the media files.