2019 East Hampshire District Council election
The 2019 East Hampshire District Council election took place on 2 May 2019 to elect members of the East Hampshire District Council in England. It was held on the same day as other local elections. New ward boundaries were used, with some new wards created, with others having their boundaries amended. Wards with the same name but amended boundaries are noted. The number of councillors was reduced from 44 to 43.[1]
| |||||||||||||||||||||||||||||||||||||||||||||||||||||
All 43 council seats 22 seats needed for a majority | |||||||||||||||||||||||||||||||||||||||||||||||||||||
|---|---|---|---|---|---|---|---|---|---|---|---|---|---|---|---|---|---|---|---|---|---|---|---|---|---|---|---|---|---|---|---|---|---|---|---|---|---|---|---|---|---|---|---|---|---|---|---|---|---|---|---|---|---|
| |||||||||||||||||||||||||||||||||||||||||||||||||||||
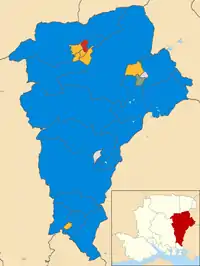 Map of the results of the 2019 election, by ward. | |||||||||||||||||||||||||||||||||||||||||||||||||||||
| |||||||||||||||||||||||||||||||||||||||||||||||||||||
The election saw the Conservatives lose 10 seats, with the Liberal Democrats (previously the only other party to hold seats in the council), Labour, and independents gaining seats. The Liberal Democrats, forming the largest opposition, with seven seats in total, an increase of five, with four seats in Alton, two in Whitehill, and one in Murray. Labour won a further two seats, and two seats returned independent councillors.[2]
Overall election result
| Party | Seats | Gains | Losses | Net gain/loss | Seats % | Votes % | Votes | +/− | |
|---|---|---|---|---|---|---|---|---|---|
| Conservative | 32 | 0 | 10 | 74.4 | 48.2 | 16,462 | |||
| Liberal Democrats | 7 | 5 | 0 | 16.3 | 28.1 | 9772 | |||
| Labour | 2 | 2 | 0 | 4.7 | 10.4 | 3554 | |||
| Green | 0 | 0 | 0 | 0 | 0 | 10.4 | 3544 | ||
| UKIP | 0 | 0 | 0 | 0 | 0 | 2.1 | 732 | ||
| Independent | 2 | 2 | 0 | 0 | 4.3 | 1333 | |||
| Justice & Anti-Corruption | 0 | 0 | 0 | 0 | 0 | 0.8 | 265 | ||
Results by Ward
Alton Amery
| Party | Candidate | Votes | % | ±% | |
|---|---|---|---|---|---|
| Liberal Democrats | Steve Hunt | 405 | 52.87 | ||
| Conservative | Danny Green | 277 | 36.16 | ||
| Labour | Robert Peters | 84 | 10.96 | ||
| Majority | 128 | 16.71 | |||
| Turnout | 766 | ||||
| Liberal Democrats gain from Conservative | Swing | ||||
Alton Ashdell
| Party | Candidate | Votes | % | ±% | |
|---|---|---|---|---|---|
| Liberal Democrats | Suzie Burns | 426 | 54.82 | ||
| Conservative | Andrew Joy | 297 | 38.22 | ||
| Labour | Jenny Abbott | 54 | 6.94 | ||
| Majority | 129 | 16.60 | |||
| Turnout | 777 | ||||
| Liberal Democrats gain from Conservative | Swing | ||||
Alton Eastbrooke
| Party | Candidate | Votes | % | ±% | |
|---|---|---|---|---|---|
| Labour | Paula Langley | 197 | 35.94 | ||
| Conservative | Dean Phillips | 178 | 32.48 | ||
| Liberal Democrats | Steve Coatsworth | 173 | 31.56 | ||
| Majority | 19 | 3.46 | |||
| Turnout | 548 | ||||
| Labour gain from Conservative | Swing | ||||
Alton Holybourne
| Party | Candidate | Votes | % | ±% | |
|---|---|---|---|---|---|
| Conservative | Graham Hill | 353 | 47.00 | ||
| Liberal Democrats | Nicholas James | 281 | 37.41 | ||
| Labour | Barbara Tansey | 117 | 15.57 | ||
| Majority | 72 | 9.58 | |||
| Turnout | 751 | ||||
| Conservative win (new seat) | |||||
Alton Westbrooke
| Party | Candidate | Votes | % | ±% | |
|---|---|---|---|---|---|
| Liberal Democrats | Richard Platt | 359 | 47.05 | ||
| Conservative | Peter Hicks | 286 | 37.48 | ||
| Labour | Ian Abbott | 118 | 15.46 | ||
| Majority | 73 | 9.56 | |||
| Turnout | 763 | ||||
| Liberal Democrats gain from Conservative | Swing | ||||
Alton Whitedown
| Party | Candidate | Votes | % | ±% | |
|---|---|---|---|---|---|
| Liberal Democrats | Ginny Boxall | 643 | 68.91 | ||
| Conservative | Jane Costigan | 234 | 25.08 | ||
| Labour | Janice Treacher | 56 | 6.00 | ||
| Majority | 409 | 43.83 | |||
| Turnout | 933 | ||||
| Liberal Democrats gain from Conservative | Swing | ||||
Alton Wooteys
| Party | Candidate | Votes | % | ±% | |
|---|---|---|---|---|---|
| Labour | Stephen Dolan | 369 | 51.60 | ||
| Conservative | David Orme | 346 | 48.39 | ||
| Majority | 23 | 3.21 | |||
| Turnout | 715 | ||||
| Labour gain from Conservative | Swing | ||||
Bentworth & Froyle
| Party | Candidate | Votes | % | ±% | |
|---|---|---|---|---|---|
| Conservative | Tony Costigan | 652 | 76.34 | ||
| Labour | Jenniann Davies | 202 | 23.65 | ||
| Majority | 450 | 52.69 | |||
| Turnout | 854 | ||||
| Conservative win (new seat) | |||||
Binsted, Bentley & Selborne
| Party | Candidate | Votes | % | ±% | |
|---|---|---|---|---|---|
| Conservative | David Ashcroft | 1,029 | 48.21 | ||
| Conservative | Ken Carter | 889 | |||
| Liberal Democrats | Lynne Ravenscroft | 839 | 39.31 | ||
| Labour | Jane-Frances Price | 266 | 12.46 | ||
| Labour | Barbara Burfoot | 192 | |||
| Majority | 190 | 8.90 | |||
| Turnout | 2134 | ||||
| Conservative win (new seat) | |||||
| Conservative win (new seat) | |||||
Bramshott & Liphook
| Party | Candidate | Votes | % | ±% | |
|---|---|---|---|---|---|
| Conservative | Bill Mouland | 1421 | 57.02 | ||
| Conservative | Angela Glass | 1372 | |||
| Conservative | Rebecca Standish | 1348 | |||
| Labour | John Tough | 479 | 19.22 | ||
| Labour | Matt Twist | 475 | |||
| Labour | Neil Niblock | 394 | |||
| UKIP | Susan Bentley | 327 | 13.12 | ||
| Justice & Anti-Corruption | Don Jerrard | 265 | 10.63 | ||
| Justice & Anti-Corruption | Eddie Trotter | 236 | |||
| Majority | 942 | 37.80 | |||
| Turnout | 2492 | ||||
| Conservative hold | Swing | ||||
| Conservative hold | Swing | ||||
| Conservative hold | Swing | ||||
Buriton & East Meon
| Party | Candidate | Votes | % | ±% | |
|---|---|---|---|---|---|
| Conservative | Robert Mocatta | 459 | 54.12 | ||
| Green | Pippa Lee | 310 | 36.55 | ||
| Labour | Greg Ford | 79 | 9.31 | ||
| Majority | 149 | 37.80 | |||
| Turnout | 848 | ||||
| Conservative win (new seat) | |||||
Clanfield
| Party | Candidate | Votes | % | ±% | |
|---|---|---|---|---|---|
| Conservative | Arthur Agate | 715 | 53.92 | ||
| Conservative | Ken Moon | 711 | |||
| Liberal Democrats | Richard Robinson | 611 | 46.07 | ||
| Majority | 104 | 7.84 | |||
| Turnout | 1326 | ||||
| Conservative win (new seat) | |||||
| Conservative win (new seat) | |||||
Four Marks & Medstead
| Party | Candidate | Votes | % | ±% | |
|---|---|---|---|---|---|
| Conservative | Ingrid Catherine | 1,439 | 45.66 | ||
| Conservative | Jonathan May | 1,281 | |||
| Conservative | Diana Tennyson | 1,263 | |||
| Liberal Democrats | Ralph Gwilt | 819 | 25.99 | ||
| Green | Benjamin Malam | 671 | 21.29 | ||
| Labour | Julie Nicholson | 222 | 7.04 | ||
| Labour | Don Hammond | 196 | |||
| Labour | Ivan Mowse | 145 | |||
| Majority | 620 | 7.84 | |||
| Turnout | 3151 | ||||
| Conservative win (new seat) | |||||
| Conservative win (new seat) | |||||
| Conservative win (new seat) | |||||
Froxfield, Sheet & Steep
| Party | Candidate | Votes | % | ±% | |
|---|---|---|---|---|---|
| Conservative | Nick Drew | 567 | 55.04 | ||
| Liberal Democrats | Louise Bevan | 401 | 38.93 | ||
| Labour | Phil Cottrell | 62 | 6.01 | ||
| Majority | 166 | 16.11 | |||
| Turnout | 1030 | ||||
| Conservative win (new seat) | |||||
Grayshott
| Party | Candidate | Votes | % | ±% | |
|---|---|---|---|---|---|
| Conservative | Ferris Cowper | 451 | 56.65 | ||
| Liberal Democrats | David Jamieson | 245 | 30.77 | ||
| UKIP | Ted Wildey | 70 | 8.79 | ||
| Labour | Larisa Mendresse-Elder | 30 | 3.76 | ||
| Majority | 206 | 25.87 | |||
| Turnout | 796 | ||||
| Conservative hold | Swing | ||||
Headley
| Party | Candidate | Votes | % | ±% | |
|---|---|---|---|---|---|
| Conservative | Anthony Williams | 978 | 60.74 | ||
| Conservative | Richard Millard | 877 | |||
| Liberal Democrats | Lesley Shepherd | 520 | 32.29 | ||
| Liberal Democrats | Anna Lubelska | 513 | |||
| Labour | Julia Deacon | 112 | 6.95 | ||
| Labour | Francis Macnamara | 86 | |||
| Majority | 458 | 28.44 | |||
| Turnout | 1610 | ||||
| Conservative hold | Swing | ||||
| Conservative hold | Swing | ||||
Horndean Downs
| Party | Candidate | Votes | % | ±% | |
|---|---|---|---|---|---|
| Conservative | Tony Denton | 425 | 52.66 | ||
| Green | Laurent Coffre | 128 | 15.86 | ||
| Independent | David Alexadner | 151 | 18.71 | ||
| Liberal Democrats | Ian Maiden | 103 | 12.76 | ||
| Majority | 297 | 36.80 | |||
| Turnout | 807 | ||||
| Conservative hold | Swing | ||||
Horndean Kings & Blendworth
| Party | Candidate | Votes | % | ±% | |
|---|---|---|---|---|---|
| Conservative | David Evans | 703 | 45.26 | ||
| Conservative | Christopher Hatter | 629 | |||
| Liberal Democrats | John Smart | 472 | 30.39 | ||
| Green | Mike Sievwright | 378 | 24.33 | ||
| Majority | 231 | 14.87 | |||
| Turnout | 1,553 | ||||
| Conservative win (new seat) | |||||
| Conservative win (new seat) | |||||
Horndean Murray
| Party | Candidate | Votes | % | ±% | |
|---|---|---|---|---|---|
| Liberal Democrats | Elaine Woodard | 326 | 53.26 | ||
| Conservative | Lynn Evans | 286 | 46.73 | ||
| Majority | 40 | 6.53 | |||
| Turnout | 612 | ||||
| Liberal Democrats gain from Conservative | Swing | ||||
Lindford
| Party | Candidate | Votes | % | ±% | |
|---|---|---|---|---|---|
| Independent | Neville Taylor | 371 | 46.84 | ||
| Conservative | Derek Barr | 250 | 31.56 | ||
| Liberal Democrats | Frank Levene | 79 | 9.97 | ||
| UKIP | Geoffrey Bentley | 58 | 7.32 | ||
| Labour | Simon Banks van Zyl | 34 | 4.29 | ||
| Majority | 121 | 15.27 | |||
| Turnout | 792 | ||||
| Independent win (new seat) | |||||
Liss
| Party | Candidate | Votes | % | ±% | |
|---|---|---|---|---|---|
| Conservative | Keith Budden | 1009 | 40.73 | ||
| Conservative | Russell Oppenheimer | 871 | |||
| Liberal Democrats | Roger Mullenger | 600 | 24.22 | ||
| Green | Ian James | 594 | 23.98 | ||
| Labour | Sheila Baldwin | 274 | 11.06 | ||
| Labour | Howard Linsley | 238 | |||
| Majority | 409 | 16.51 | |||
| Turnout | 2477 | ||||
| Conservative hold | Swing | ||||
Petersfield Bell Hill
| Party | Candidate | Votes | % | ±% | |
|---|---|---|---|---|---|
| Independent | Jamie Matthews | 467 | 51.37 | ||
| Conservative | Peter Doyle | 179 | 19.69 | ||
| Green | John Hilton | 140 | 15.40 | ||
| Labour | Steve Elder | 68 | 7.48 | ||
| UKIP | Jim Makin | 55 | 6.05 | ||
| Majority | 288 | 31.68 | |||
| Turnout | 909 | ||||
| Independent win (new seat) | |||||
Petersfield Causeway
| Party | Candidate | Votes | % | ±% | |
|---|---|---|---|---|---|
| Conservative | Ben Bentley | 281 | 43.49 | ||
| Liberal Democrats | John Hutchinson | 273 | 42.26 | ||
| Labour | Colin Brazier | 92 | 14.24 | ||
| Majority | 8 | 1.23 | |||
| Turnout | 646 | ||||
| Conservative hold | Swing | ||||
Petersfield Heath
| Party | Candidate | Votes | % | ±% | |
|---|---|---|---|---|---|
| Conservative | Julie Butler | 467 | 49.47 | ||
| Liberal Democrats | Angus Robinson | 196 | 20.76 | ||
| Green | Zoe Parker | 147 | 15.57 | ||
| Labour | Bill Organ | 71 | 7.52 | ||
| UKIP | Malcom Bint | 63 | 6.67 | ||
| Majority | 271 | 28.70 | |||
| Turnout | 944 | ||||
| Conservative hold | Swing | ||||
Petersfield St Peter's
| Party | Candidate | Votes | % | ±% | |
|---|---|---|---|---|---|
| Conservative | Matthew Gass | 611 | 24.79 | ||
| Conservative | David McKinney | 598 | |||
| Liberal Democrats | David Podger | 558 | 22.64 | ||
| Liberal Democrats | Phil Shaw | 545 | |||
| Green | John Palmer | 525 | 21.30 | ||
| Independent | Jonathan Walker | 438 | 17.77 | ||
| Labour | Jeremy Abraham | 143 | 5.80 | ||
| Labour | Sarah Morris | 173 | |||
| UKIP | Ben James | 159 | |||
| Majority | 53 | 2.17 | |||
| Turnout | 2,434 | ||||
| Conservative hold | Swing | ||||
| Conservative hold | Swing | ||||
Ropley, Hawkley & Hangers
| Party | Candidate | Votes | % | ±% | |
|---|---|---|---|---|---|
| Conservative | Charles Louisson | 710 | 68.26 | ||
| Green | Marie-Marthe Gervais | 286 | 27.50 | ||
| Labour | Stephen Whitehead | 44 | 4.23 | ||
| Majority | 424 | 40.76 | |||
| Turnout | 1040 | ||||
| Conservative win (new seat) | |||||
Rowlands Castle
| Party | Candidate | Votes | % | ±% | |
|---|---|---|---|---|---|
| Conservative | Malcom Johnson | 534 | 59.39 | ||
| Green | Peter Bisset | 365 | 40.60 | ||
| Majority | 169 | 18.79 | |||
| Turnout | 899 | ||||
| Conservative hold | Swing | ||||
Whitehill Chase
| Party | Candidate | Votes | % | ±% | |
|---|---|---|---|---|---|
| Conservative | Sally Pond | 552 | 43.43 | ||
| Liberal Democrats | Paul Wigman | 543 | 42.72 | ||
| Conservative | Anthony Muldoon | 512 | |||
| Liberal Democrats | Thomas Coleman | 428 | |||
| Labour | Alina Vraible | 176 | 13.84 | ||
| Labour | David Ilsley | 162 | |||
| Turnout | 1,271 | ||||
| Conservative hold | Swing | ||||
| Liberal Democrats win (new seat) | |||||
Whitehill Hogmoor & Greatham
| Party | Candidate | Votes | % | ±% | |
|---|---|---|---|---|---|
| Conservative | Adam Carew | 689 | 49.96 | ||
| Conservative | Philip Davies | 589 | |||
| Liberal Democrats | Antony Gray | 562 | 40.75 | ||
| Liberal Democrats | Michael Croucher | 520 | |||
| Labour | Mercy Bolus | 128 | 9.28 | ||
| Labour | Moira Johnson | 120 | |||
| Majority | 127 | 9.20 | |||
| Turnout | 1379 | ||||
| Conservative win (new seat) | |||||
| Conservative win (new seat) | |||||
Whitehill Pinewood
| Party | Candidate | Votes | % | ±% | |
|---|---|---|---|---|---|
| Liberal Democrats | Trevor Maroney | 149 | 45.15 | ||
| Conservative | Neil Ward | 134 | 40.60 | ||
| Labour | Tom Barnett | 47 | 14.24 | ||
| Majority | 15 | 4.54 | |||
| Turnout | 330 | ||||
| Liberal Democrats gain from Conservative | Swing | ||||
References
- "New electoral arrangements for East Hampshire District Council: Final recommendations" (PDF). The Local Government Boundary Commission for England. April 2018.
- "Local Elections: Bruising night for Tories in East Hampshire". Farnham Herald. Retrieved 3 September 2020.
- "Election Results" (PDF). East Hampshire District Council. Retrieved 24 April 2020.
Notes
- New Ward Boundaries