2019 New Forest District Council election
The 2019 New Forest District Council election took place on 2 May 2019 to elect members of New Forest District Council in England.[1] This was on the same day as other local elections. The Conservatives were the only party to stand enough candidates to gain an outright majority, as they were the only party to stand a candidate in more than half the seats, with Liberal Democrats, who defended 2 seats, standing 28 candidates, and Labour, which had no incumbents, standing 30 candidates. [2]
| |||||||||||||||||||||||||
All 60 seats to New Forest District Council 31 seats needed for a majority | |||||||||||||||||||||||||
|---|---|---|---|---|---|---|---|---|---|---|---|---|---|---|---|---|---|---|---|---|---|---|---|---|---|
| |||||||||||||||||||||||||
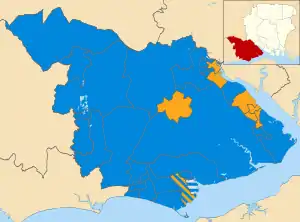 Results by Ward | |||||||||||||||||||||||||
| |||||||||||||||||||||||||
Results summary
| Party | Seats | Gains | Losses | Net gain/loss | Seats % | Votes % | Votes | +/− | |
|---|---|---|---|---|---|---|---|---|---|
| Conservative | 46 | 0 | 12 | 76.7 | 58.85 | 43,302 | |||
| Liberal Democrats | 13 | 11 | 0 | 23.79 | 23.8 | 17,509 | |||
| Independent | 1 | 1 | 0 | 2.56 | 2.56 | 1,884 | |||
| Labour | 0 | 0 | 0 | 0.0 | 10.83 | 7,975 | |||
| Green | 0 | 0 | 0 | 0.0 | 3.17 | 2,333 | |||
| UKIP | 0 | 0 | 0 | 0.0 | 0.77 | 572 | |||
Ward results
Ashurst, Copythorne South & Netley Marsh
| Party | Candidate | Votes | % | ±% | |
|---|---|---|---|---|---|
| Conservative | Derek Tipp | 923 | 59.62 | ||
| Conservative | Joseph Reilly | 899 | |||
| Liberal Democrats | Amy Hardingson | 625 | 40.37 | ||
| Majority | 298 | 19.25 | |||
| Turnout | 1,548 | 34.0 | |||
| Conservative hold | |||||
| Conservative hold | |||||
Barton
| Party | Candidate | Votes | % | ±% | |
|---|---|---|---|---|---|
| Conservative | Keith Craze | 1,129 | 59.70 | ||
| Conservative | Alan O'Sullivan | 1,123 | |||
| Liberal Democrats | Chloe Bellamy | 498 | 26.33 | ||
| Labour Co-op | Peter Terry | 264 | 13.96 | ||
| Majority | 631 | 33.36 | |||
| Turnout | 1,891 | 36.0 | |||
| Conservative hold | |||||
| Conservative hold | |||||
Bashley
| Party | Candidate | Votes | % | ±% | |
|---|---|---|---|---|---|
| Conservative | Donald Tungate | 599 | 80.18 | ||
| Labour | Susan Seymour | 148 | 19.81 | ||
| Majority | 451 | 60.37 | |||
| Turnout | 747 | 34.0 | |||
| Conservative hold | Swing | ||||
Becton
| Party | Candidate | Votes | % | ±% | |
|---|---|---|---|---|---|
| Conservative | Geoffrey Blunden | 731 | 49.82 | ||
| Conservative | Christine Ward | 682 | |||
| Liberal Democrats | Wynford Davies | 335 | 22.83 | ||
| UKIP | Ann Vasilesco | 217 | 14.79 | ||
| Labour | Ann Russell | 184 | 12.54 | ||
| Majority | 26.99 | 396 | |||
| Turnout | 1,467 | 32.0 | |||
| Conservative hold | |||||
| Conservative hold | |||||
Boldre & Sway
| Party | Candidate | Votes | % | ±% | |
|---|---|---|---|---|---|
| Conservative | Barry Rickman | 1,053 | 55.53 | ||
| Conservative | Janette Duke | 854 | |||
| Green | Katherine Wilcox | 843 | 44.46 | ||
| Majority | 1,896 | 11.07 | |||
| Turnout | 1,896 | 39.0 | |||
| Conservative hold | |||||
| Conservative hold | |||||
Bramshaw, Copythorne North & Minstead
| Party | Candidate | Votes | % | ±% | |
|---|---|---|---|---|---|
| Conservative | Diane Andrews | Unopposed | |||
| Majority | |||||
| Turnout | |||||
| Conservative hold | |||||
Bransgore & Burley
| Party | Candidate | Votes | % | ±% | |
|---|---|---|---|---|---|
| Conservative | Martyn Levitt | 1,002 | 72.24 | ||
| Conservative | Mark Steele | 964 | |||
| Labour | Aimee Geyther | 385 | 27.75 | ||
| Majority | 617 | 44.48 | |||
| Turnout | 1,387 | 33.0 | |||
| Conservative hold | |||||
| Conservative hold | |||||
Brockenhurst & Forest South
| Party | Candidate | Votes | % | ±% | |
|---|---|---|---|---|---|
| Conservative | Maureen Holding | 950 | 40.00 | ||
| Conservative | Michael Harris | 948 | |||
| Liberal Democrats | Ruth Rollin | 630 | 26.52 | ||
| Green | Henry Mellor | 586 | 24.67 | ||
| Labour | Peter Dance | 209 | 8.79 | ||
| Majority | 320 | 13.47 | |||
| Turnout | 2,375 | 39.0 | |||
| Conservative hold | |||||
| Conservative hold | |||||
Buckland
| Party | Candidate | Votes | % | ±% | |
|---|---|---|---|---|---|
| Conservative | Anne Corbridge | 356 | 46.35 | ||
| Liberal Democrats | Sandra Tyler | 190 | 24.73 | ||
| Independent | Edward Jearrad | 116 | 15.10 | ||
| Labour | Bronwen Bridges | 106 | 13.80 | ||
| Majority | 166 | 21.61 | |||
| Turnout | 768 | 28.0 | |||
| Conservative hold | Swing | ||||
Butts Ash & Dibden Purlieu
| Party | Candidate | Votes | % | ±% | |
|---|---|---|---|---|---|
| Liberal Democrats | Malcolm Wade | 1,096 | 62.09 | ||
| Liberal Democrats | Stephenie Osbourne | 901 | |||
| Conservative | James Binns | 669 | 37.90 | ||
| Conservative | Peter Armstrong | 650 | |||
| Majority | 427 | 24.19 | |||
| Turnout | 1,765 | 36.0 | |||
| Liberal Democrats gain from Conservative | |||||
| Liberal Democrats gain from Conservative | |||||
Dibden & Hythe
| Party | Candidate | Votes | % | ±% | |
|---|---|---|---|---|---|
| Liberal Democrats | Sandra Delemare | 804 | 56.57 | ||
| Liberal Democrats | Philip Dowd | 745 | |||
| Conservative | Christopher Harrison | 617 | 43.42 | ||
| Conservative | Daniel Poole | 609 | |||
| Majority | 187 | 13.15 | |||
| Turnout | 1,421 | 34.0 | |||
| Liberal Democrats gain from Conservative | |||||
| Liberal Democrats gain from Conservative | |||||
Downlands & Forest
| Party | Candidate | Votes | % | ±% | |
|---|---|---|---|---|---|
| Conservative | Edward Heron | 597 | 60.73 | ||
| Green | Janet Richards | 315 | 32.04 | ||
| Labour | Paul Toynton | 71 | 7.22 | ||
| Majority | 282 | 28.68 | |||
| Turnout | 983 | 42.0 | |||
| Conservative hold | Swing | ||||
Fawley, Blackfield & Langley
| Party | Candidate | Votes | % | ±% | |
|---|---|---|---|---|---|
| Conservative | Alexis McEvoy | 817 | 58.31 | ||
| Conservative | Alan Alvey | 783 | |||
| Liberal Democrats | Sally-Jane Read | 584 | 41.68 | ||
| Liberal Democrats | Roger Stephens | 493 | |||
| Majority | 16.63 | 233 | |||
| Turnout | 1,401 | 32.0 | |||
| Conservative hold | |||||
| Conservative hold | |||||
Fernhill
| Party | Candidate | Votes | % | ±% | |
|---|---|---|---|---|---|
| Conservative | Jill Cleary | 872 | 69.15 | ||
| Conservative | John Ward | 836 | |||
| Labour | Helen Wallis-Dowling | 389 | 30.84 | ||
| Labour | Stephen Short | 309 | |||
| Majority | 483 | 38.30 | |||
| Turnout | 1,261 | 28.0 | |||
| Conservative hold | |||||
| Conservative hold | |||||
Fordingbridge
| Party | Candidate | Votes | % | ±% | |
|---|---|---|---|---|---|
| Conservative | Ann Sevier | 762 | 41.34 | ||
| Conservative | Ann Bellows | 726 | |||
| Liberal Democrats | Tom Cornwall | 513 | 27.83 | ||
| Liberal Democrats | Alexandra Sugden | 484 | |||
| Green | Timothy Rowe | 361 | 19.58 | ||
| Labour | Sarah Sumner | 207 | 11.23 | ||
| Labour | Kevin Flack | 195 | |||
| Majority | 249 | 13.51 | |||
| Turnout | 1,843 | 34.0 | |||
| Conservative hold | |||||
| Conservative hold | |||||
Forest North West
Seat had been unopposed in 2015 election.
| Party | Candidate | Votes | % | ±% | |
|---|---|---|---|---|---|
| Conservative | Emma Lane | 445 | 61.97 | ||
| Green | Nicola Jolly | 228 | 31.75 | ||
| Labour | Geoffrey Purser | 45 | 6.26 | ||
| Majority | 216 | 30.83 | |||
| Majority | |||||
| Turnout | 718 | 35.0 | |||
| Conservative hold | Swing | ||||
Furzedown & Hardley
| Party | Candidate | Votes | % | ±% | |
|---|---|---|---|---|---|
| Liberal Democrats | Mark Clark | 357 | 46.72 | ||
| Conservative | Josephine Poole | 284 | 37.17 | ||
| Labour | Adam Barak | 123 | 16.09 | ||
| Majority | 73 | 9.55 | |||
| Turnout | 764 | 29.0 | |||
| Liberal Democrats gain from Conservative | Swing | ||||
Holbury & North Blackfield
| Party | Candidate | Votes | % | ±% | |
|---|---|---|---|---|---|
| Conservative | Allan Glass | 711 | 66.94 | ||
| Conservative | Beverley Thorne | 598 | |||
| Labour | Pauline Brown | 351 | 33.05 | ||
| Labour | Julie Renyard | 334 | |||
| Majority | |||||
| Turnout | 33.05 | 23.0 | |||
| Conservative hold | |||||
| Conservative hold | |||||
Hordle
| Party | Candidate | Votes | % | ±% | |
|---|---|---|---|---|---|
| Conservative | Frances Carpenter | 1,190 | 62.99 | ||
| Conservative | Richard Reid | 854 | |||
| UKIP | Paul Bailey | 355 | 18.79 | ||
| Labour | Gordon De La Mare | 344 | 18.21 | ||
| Majority | |||||
| Turnout | 1,889 | 36.0 | |||
| Conservative hold | |||||
| Conservative hold | |||||
Hythe West & Langdown
| Party | Candidate | Votes | % | ±% | |
|---|---|---|---|---|---|
| Liberal Democrats | Alexander Wade | 1,179 | 67.87 | ||
| Liberal Democrats | Rebecca Clark | 1,148 | |||
| Conservative | Teresa Marwood | 558 | 32.12 | ||
| Conservative | Claire Terrill | 544 | |||
| Majority | |||||
| Turnout | 1,737 | 38.0 | |||
| Liberal Democrats hold | |||||
| Liberal Democrats gain from Conservative | |||||
Lymington Town
| Party | Candidate | Votes | % | ±% | |
|---|---|---|---|---|---|
| Independent | Jacqueline England | 1,083 | 41.96 | ||
| Conservative | Barry Dunning | 1,057 | 40.95 | ||
| Conservative | Alan Penson | 830 | |||
| Labour | Catriona Hart | 441 | 17.86 | ||
| Majority | |||||
| Turnout | 2,581 | 41.0 | |||
| Independent gain from Conservative | |||||
| Conservative hold | |||||
Lyndhurst
| Party | Candidate | Votes | % | ±% | |
|---|---|---|---|---|---|
| Liberal Democrats | Hilary Brand | 501 | 51.22 | ||
| Conservative | William Andrews | 477 | 48.77 | ||
| Majority | |||||
| Turnout | 978 | 40.0 | |||
| Liberal Democrats gain from Conservative | Swing | ||||
Marchwood
| Party | Candidate | Votes | % | ±% | |
|---|---|---|---|---|---|
| Conservative | Alison Hoare | 785 | 58.53 | ||
| Conservative | Susan Bennison | 594 | |||
| Liberal Democrats | John Holden | 556 | 41.46 | ||
| Liberal Democrats | Matthew Kitcher | 489 | |||
| Majority | |||||
| Turnout | 1,341 | ||||
| Conservative hold | |||||
| Conservative hold | |||||
Milford
| Party | Candidate | Votes | % | ±% | |
|---|---|---|---|---|---|
| Conservative | Christine Hopkins | 1,114 | 73.82 | ||
| Conservative | David Hawkins | 1,038 | |||
| Labour | Sally Spicer | 395 | 26.17 | ||
| Majority | |||||
| Turnout | 1,509 | 37.0 | |||
| Conservative hold | |||||
| Conservative hold | |||||
Milton
| Party | Candidate | Votes | % | ±% | |
|---|---|---|---|---|---|
| Conservative | Stephen Davies | 825 | 50.58 | ||
| Conservative | Stephen Clarke | 815 | |||
| Liberal Democrats | Judith Baker | 491 | 30.10 | ||
| Labour | Jennie Worsdale | 315 | 19.31 | ||
| Majority | |||||
| Turnout | 1,631 | 28.0 | |||
| Conservative hold | |||||
| Conservative hold | |||||
Pennington
| Party | Candidate | Votes | % | ±% | |
|---|---|---|---|---|---|
| Liberal Democrats | Jack Davies | 650 | 45.32 | ||
| Conservative | Andrew Gossage | 640 | 44.63 | ||
| Conservative | Michael White | 617 | |||
| Liberal Democrats | Colm McCarthy | 491 | |||
| Labour | Paul Button | 144 | 10.04 | ||
| Labour | Franki Cleeter | 126 | |||
| Majority | |||||
| Turnout | 1,434 | 30.0 | |||
| Liberal Democrats gain from Conservative | |||||
| Conservative hold | |||||
Ringwood East & Sopley
Seat had been unopposed in 2015 election.
| Party | Candidate | Votes | % | ±% | |
|---|---|---|---|---|---|
| Conservative | Keith Ring | 564 | 75.70 | ||
| Labour | Janet Briddick | 181 | 24.29 | ||
| Majority | 745 | ||||
| Turnout | 33.0 | ||||
| Conservative hold | Swing | ||||
Ringwood North
| Party | Candidate | Votes | % | ±% | |
|---|---|---|---|---|---|
| Conservative | Michael Thierry | 797 | 60.24 | ||
| Conservative | Joshua Kidd | 767 | |||
| Labour | John Haywood | 526 | 39.75 | ||
| Labour | Peter Kelleher | 512 | |||
| Majority | |||||
| Turnout | 1,323 | 30.0 | |||
| Conservative hold | |||||
| Conservative hold | |||||
Ringwood South
| Party | Candidate | Votes | % | ±% | |
|---|---|---|---|---|---|
| Conservative | Jeremy Heron | 768 | 60.32 | ||
| Conservative | William Rippon-Swaine | 765 | |||
| Labour | Linda Turner | 505 | 39.67 | ||
| Labour | Paul Iggulden | 408 | |||
| Majority | |||||
| Turnout | 1,273 | 29.0 | |||
| Conservative hold | |||||
| Conservative hold | |||||
Totton Central
| Party | Candidate | Votes | % | ±% | |
|---|---|---|---|---|---|
| Conservative | Ian Murray | 613 | 54.10 | ||
| Conservative | Louise Cerasoli | 600 | |||
| Labour | Jayne Laysan | 261 | 23.03 | ||
| Independent | Ronald Scrivens | 259 | 22.85 | ||
| Labour | Katherine Herbert | 236 | |||
| Independent | Frances Orchard | 202 | |||
| Majority | |||||
| Turnout | 1,133 | 28.0 | |||
| Conservative hold | |||||
| Conservative hold | |||||
Totton East
| Party | Candidate | Votes | % | ±% | |
|---|---|---|---|---|---|
| Liberal Democrats | Alexander Brunsdon | 669 | 46.75 | ||
| Liberal Democrats | Mahmoud Kangarani | 635 | |||
| Conservative | David Penny | 538 | 37.59 | ||
| Conservative | Ian Coombes | 535 | |||
| Independent | Christopher Lagdon | 224 | 15.65 | ||
| Majority | |||||
| Turnout | 1,431 | 29.0 | |||
| Liberal Democrats gain from Conservative | |||||
| Liberal Democrats gain from Conservative | |||||
Totton North
| Party | Candidate | Votes | % | ±% | |
|---|---|---|---|---|---|
| Conservative | Neville Penman | 700 | 63.92 | ||
| Conservative | Arthur Davis | 615 | |||
| Liberal Democrats | Jacqueline Shaw | 395 | 36.07 | ||
| Liberal Democrats | Benjamin Thompson | 322 | |||
| Majority | |||||
| Turnout | 1,095 | 24.0 | |||
| Conservative hold | |||||
| Conservative hold | |||||
Totton South
| Party | Candidate | Votes | % | ±% | |
|---|---|---|---|---|---|
| Liberal Democrats | David Harrison | 993 | 70.72 | ||
| Liberal Democrats | Caroline Rackham | 735 | |||
| Conservative | Leonard Harris | 411 | 29.27 | ||
| Conservative | Kate Lord | 358 | |||
| Majority | |||||
| Turnout | 29.27 | 30.0 | |||
| Liberal Democrats hold | |||||
| Liberal Democrats gain from Conservative | |||||
Totton West
| Party | Candidate | Votes | % | ±% | |
|---|---|---|---|---|---|
| Conservative | Kathleen Crisell | 599 | 67.45 | ||
| Conservative | David Russell | 545 | |||
| Labour | Helen Field | 289 | 32.54 | ||
| Labour | Jhn Rochey-Adams | 242 | |||
| Majority | |||||
| Turnout | 888 | 25.0 | |||
| Conservative hold | |||||
| Conservative hold | |||||
References
- https://www.newforest.gov.uk/article/1084/Previous-Election-Results#district
- Craig, Ben (2019-04-10). "Tories only party with full slate of election runners". Advertiser and Times. Retrieved 2020-10-07.
This article is issued from Wikipedia. The text is licensed under Creative Commons - Attribution - Sharealike. Additional terms may apply for the media files.