Electoral history of Boris Johnson
This is a summary of the electoral history of Boris Johnson, the Member of Parliament for Uxbridge and South Ruislip since 2015 and incumbent Prime Minister of the United Kingdom since 24 July 2019. He has previously served as Mayor of London from 2008 to 2016 and Foreign Secretary from 2016 to 2018.
| ||
|---|---|---|
|
Mayor of London
European Union referendum
Foreign Secretary
Party leadership campaign Prime Minister of the United Kingdom
First ministry and term
Second ministry and term
|
||
Parliamentary elections
1997 general election, Clwyd South
| Party | Candidate | Votes | % | ±% | |
|---|---|---|---|---|---|
| Labour | Martyn Jones | 22,901 | 58.1 | N/A | |
| Conservative | Boris Johnson | 9,091 | 23.1 | N/A | |
| Liberal Democrats | Andrew Chadwick | 3,684 | 9.4 | N/A | |
| Plaid Cymru | Gareth V. Williams | 2,500 | 6.3 | N/A | |
| Referendum | Alex Lewis | 1,207 | 3.1 | N/A | |
| Majority | 13,810 | 35.0 | N/A | ||
| Turnout | 39,383 | 73.6 | N/A | ||
| Registered electors | 53,495 | ||||
| Labour win (new seat) | |||||
2001 general election, Henley
| Party | Candidate | Votes | % | ±% | |
|---|---|---|---|---|---|
| Conservative | Boris Johnson | 20,466 | 46.1 | ||
| Liberal Democrats | Catherine Bearder | 12,008 | 27.0 | ||
| Labour | Janet Matthews | 9,367 | 21.1 | ||
| UKIP | Philip Collings | 1,413 | 3.2 | N/A | |
| Green | Oliver Tickell | 1,147 | 2.6 | ||
| Majority | 8,458 | 19.1 | |||
| Turnout | 44,401 | 64.3 | |||
| Conservative hold | Swing | ||||
2005 general election, Henley
| Party | Candidate | Votes | % | ±% | |
|---|---|---|---|---|---|
| Conservative | Boris Johnson | 24,894 | 53.5 | ||
| Liberal Democrats | David Turner | 12,101 | 26.0 | ||
| Labour | Kaleem Saeed | 6,862 | 14.7 | ||
| Green | Mark Stevenson | 1,518 | 3.3 | ||
| UKIP | Delphine Gray-Fisk | 1,162 | 2.5 | ||
| Majority | 12,793 | 27.5 | |||
| Turnout | 46,537 | 67.9 | |||
| Conservative hold | Swing | ||||
2015 general election, Uxbridge and South Ruislip
| Party | Candidate | Votes | % | ±% | |
|---|---|---|---|---|---|
| Conservative | Boris Johnson | 22,511 | 50.2 | ||
| Labour | Chris Summers[9] | 11,816 | 26.4 | ||
| UKIP | Jack Duffin | 6,346 | 14.2 | ||
| Liberal Democrats | Michael Cox | 2,215 | 4.9 | ||
| Green | Graham Lee[10] | 1,414 | 3.2 | ||
| TUSC | Gary Harbord[11] | 180 | 0.4 | New | |
| Independent | Jenny Thompson[12] | 84 | 0.2 | New | |
| Monster Raving Loony | Howling Laud Hope[13] | 72 | 0.2 | New | |
| Communities United | Sabrina Moosun[12] | 52 | 0.1 | New | |
| The Eccentric Party of Great Britain (UK) | Lord Toby Jug[12] | 50 | 0.1 | New | |
| Independent | Michael Doherty[12] | 39 | 0.1 | New | |
| The Realists' Party | Jane Lawrence[12] | 18 | 0.0 | New | |
| Independent | James Jackson[12] | 14 | 0.0 | New | |
| Majority | 10,695 | 23.8 | |||
| Turnout | 44,811 | 63.4 | |||
| Registered electors | 70,631 | ||||
| Conservative hold | Swing | ||||
2017 general election, Uxbridge and South Ruislip
| Party | Candidate | Votes | % | ±% | |
|---|---|---|---|---|---|
| Conservative | Boris Johnson | 23,716 | 50.8 | ||
| Labour | Vincent Lo | 18,682 | 40.0 | ||
| Liberal Democrats | Rosina Robson | 1,835 | 3.9 | ||
| UKIP | Lizzy Kemp | 1,577 | 3.4 | ||
| Green | Mark Keir | 884 | 1.9 | ||
| Majority | 5,034 | 10.8 | |||
| Turnout | 46,694 | 66.8 | |||
| Registered electors | 69,936 | ||||
| Conservative hold | Swing | ||||
2019 general election, Uxbridge and South Ruislip
| Party | Candidate | Votes | % | ±% | |
|---|---|---|---|---|---|
| Conservative | Boris Johnson | 25,351 | 52.6 | ||
| Labour | Ali Milani | 18,141 | 37.6 | ||
| Liberal Democrats | Joanne Humphreys | 3,026 | 6.3 | ||
| Green | Mark Keir | 1,090 | 2.3 | ||
| UKIP | Geoffrey Courtenay | 283 | 0.6 | ||
| Monster Raving Loony | Lord Buckethead | 125 | 0.3 | New | |
| Independent | Count Binface | 69 | 0.1 | New | |
| Independent | Alfie Utting | 44 | 0.1 | New | |
| [16] | Yace "Interplanetary Time Lord" Yogenstein | 23 | 0.0 | New | |
| Independent | Norma Burke | 22 | 0.0 | New | |
| [16] | Bobby Smith | 8 | 0.0 | New | |
| [16] | William Tobin | 5 | 0.0 | New | |
| Majority | 7,210 | 15.0 | |||
| Turnout | 48,187 | 68.5 | |||
| Registered electors | 70,369 | ||||
| Conservative hold | Swing | ||||
Mayoral elections
2008 London mayoral election
| Mayor of London election 1 May 2008 [17] | ||||||||
|---|---|---|---|---|---|---|---|---|
| Party | Candidate | 1st round | 2nd round | First round votes Transfer votes | ||||
| Total | Of round | Transfers | Total | Of round | ||||
| Conservative | Boris Johnson | 1,043,761 | 43.2% | 124,977 | 1,168,738 | 53.2% |
| |
| Labour | Ken Livingstone | 893,887 | 37.0% | 134,089 | 1,027,976 | 46.8% |
| |
| Liberal Democrats | Brian Paddick | 235,585 | 9.8% |
| ||||
| Green | Siân Berry | 77,347 | 3.2% |
| ||||
| BNP | Richard Barnbrook | 69,710 | 3.2% |
| ||||
| CPA | Alan Craig | 39,249 | 1.6% |
| ||||
| UKIP | Gerard Batten | 22,422 | 1.2% |
| ||||
| Left List | Lindsey German | 16,796 | 0.7% |
| ||||
| English Democrat | Matt O'Connor | 10,695 | 0.4% |
| ||||
| Independent | Winston McKenzie | 5,389 | 0.2% |
| ||||
| Conservative gain from Labour | ||||||||
2012 London mayoral election
| Mayor of London election 3 May 2012 [18] | ||||||||
|---|---|---|---|---|---|---|---|---|
| Party | Candidate | 1st round | 2nd round | First round votes Transfer votes | ||||
| Total | Of round | Transfers | Total | Of round | ||||
| Conservative | Boris Johnson | 971,931 | 44.0% | 82,880 | 1,054,811 | 51.5% |
| |
| Labour | Ken Livingstone | 889,918 | 40.3% | 102,355 | 992,273 | 48.5% |
| |
| Green | Jenny Jones | 98,913 | 4.5% |
| ||||
| Liberal Democrats | Brian Paddick | 91,774 | 4.2% |
| ||||
| Independent | Siobhan Benita | 83,914 | 3.8% |
| ||||
| UKIP | Lawrence Webb | 43,274 | 2.0% |
| ||||
| BNP | Carlos Gerardo Cortiglia | 28,751 | 1.3% |
| ||||
| Conservative hold | ||||||||
2019 Conservative Party leadership election
MPs' vote
| Candidate | First ballot: 13 June 2019 |
Second ballot: 18 June 2019 |
Third ballot: 19 June 2019 |
Fourth ballot: 20 June 2019 |
Fifth ballot: 20 June 2019 | |||||
|---|---|---|---|---|---|---|---|---|---|---|
| Votes | % | Votes | % | Votes | % | Votes | % | Votes | % | |
| Boris Johnson | 114 | 36.4 | 126 | 40.3 | 143 | 45.7 | 157 | 50.2 | 160 | 51.1 |
| Jeremy Hunt | 43 | 13.7 | 46 | 14.7 | 54 | 17.3 | 59 | 18.8 | 77 | 24.6 |
| Michael Gove | 37 | 11.8 | 41 | 13.1 | 51 | 16.3 | 61 | 19.5 | 75 | 24.0 |
| Sajid Javid | 23 | 7.3 | 33 | 10.5 | 38 | 12.1 | 34 | 10.9 | Eliminated | |
| Rory Stewart | 19 | 6.1 | 37 | 11.8 | 27 | 8.6 | Eliminated | |||
| Dominic Raab | 27 | 8.6 | 30 | 9.6 | Eliminated | |||||
| Matt Hancock | 20 | 6.4 | Withdrew | |||||||
| Andrea Leadsom | 11 | 3.5 | Eliminated | |||||||
| Mark Harper | 10 | 3.2 | Eliminated | |||||||
| Esther McVey | 9 | 2.9 | Eliminated | |||||||
| Spoilt ballots | 0 | 0.0 | 0 | 0.0 | 0 | 0.0 | 2 | 0.6 | 1 | 0.3 |
| Turnout | 313 | 100.0 | 313 | 100.0 | 313 | 100.0 | 313 | 100.0 | 313 | 100.0 |
Members' vote
| Candidate | Members' vote | |
|---|---|---|
| Votes | % | |
| Boris Johnson | 92,153 | 66.4 |
| Jeremy Hunt | 46,656 | 33.6 |
| Spoilt ballots | 509 | 0.4 |
| Turnout | 139,318 | 87.4 |
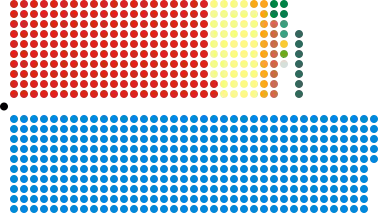
2019 United Kingdom general election
 | ||||||||||||||
| Political party | Leader | Candidates | MPs[21] | Votes | ||||||||||
|---|---|---|---|---|---|---|---|---|---|---|---|---|---|---|
| Total | Gained | Lost | Net | Of total (%) |
Total | Of total (%) |
Change (%) | |||||||
| Conservative | Boris Johnson | 635 | 365 | 58 | 10 | 56.2 | 13,966,454 | 43.6 | +1.2 | |||||
| Labour | Jeremy Corbyn | 631 | 202 | 1 | 61 | 31.1 | 10,269,051 | 32.1 | −7.9 | |||||
| Liberal Democrats | Jo Swinson | 611 | 11 | 3 | 4 | 1.7 | 3,696,419 | 11.5 | +4.2 | |||||
| SNP | Nicola Sturgeon | 59 | 48 | 14 | 1 | 7.4 | 1,242,380 | 3.9 | +0.8 | |||||
| Green | Siân Berry and Jonathan Bartley | 472 | 1 | 0 | 0 | 0 | 0.2 | 835,579 | 2.7 | +1.1 | ||||
| Brexit Party | Nigel Farage | 275 | 644,257 | 2.0 | ||||||||||
| DUP | Arlene Foster | 17 | 8 | 0 | 2 | 1.2 | 244,128 | 0.8 | −0.1 | |||||
| Sinn Féin | Mary Lou McDonald | 15 | 7 | 1 | 1 | 0 | 1.1 | 181,853 | 0.6 | −0.2 | ||||
| Plaid Cymru | Adam Price | 36 | 4 | 0 | 0 | 0 | 0.6 | 153,265 | 0.5 | 0.0 | ||||
| Alliance | Naomi Long | 18 | 1 | 1 | 0 | 0.2 | 134,115 | 0.4 | +0.2 | |||||
| SDLP | Colum Eastwood | 15 | 2 | 2 | 0 | 0.3 | 118,737 | 0.4 | +0.1 | |||||
| UUP | Steve Aiken | 16 | 93,123 | 0.3 | 0.0 | |||||||||
| Yorkshire | Christopher Whitwood | 28 | 29,201 | 0.1 | 0.0 | |||||||||
| Scottish Green | Patrick Harvie & Lorna Slater | 22 | 28,122 | 0.1 | ||||||||||
| Speaker | Lindsay Hoyle | 1 | 1 | 0.2 | 26,831 | 0.1 | 0.0 | |||||||
| UKIP | Patricia Mountain (interim) | 44 | 22,817 | 0.1 | −1.8 | |||||||||
| Ashfield Independents | Jason Zadrozny | 1 | 13,498 | 0.0 | 0.0 | |||||||||
| Liberal | Steve Radford | 19 | 10,876 | 0.0 | 0.0 | |||||||||
| The Independent Group for Change | Anna Soubry | 3 | 10,006 | 0.0 | ||||||||||
| Aontú | Peadar Tóibín | 7 | 9,814 | 0.0 | ||||||||||
| Monster Raving Loony | Howling Laud Hope | 24 | 9,739 | 0.0 | 0.0 | |||||||||
| People Before Profit | Collective | 2 | 7,526 | 0.0 | ||||||||||
| Birkenhead Social Justice | Frank Field | 1 | 7,285 | 0.0 | ||||||||||
| CPA | Sidney Cordle | 27 | 6,486 | 0.0 | 0.0 | |||||||||
| Heavy Woollen Independents | Aleksandar Lukic | 1 | 6,423 | 0.0 | ||||||||||
| SDP | William Clouston | 20 | 3,295 | 0.0 | 0.0 | |||||||||
| Animal Welfare | Vanessa Hudson | 6 | 3,086 | 0.0 | 0.0 | |||||||||
| North East Party | Mark Burdon | 2 | 2,637 | 0.0 | ||||||||||
| Lincolnshire Independent | Marianne Overton | 1 | 1,999 | 0.0 | ||||||||||
| Green (NI) | Clare Bailey | 3 | 1,996 | 0.0 | ||||||||||
| English Democrat | Robin Tilbrook | 4 | 1,987 | 0.0 | 0.0 | |||||||||
| Libertarian | Adam Brown | 5 | 1,780 | 0.0 | 0.0 | |||||||||
| Mebyon Kernow | Dick Cole | 1 | 1,660 | 0.0 | 0.0 | |||||||||
| Proud of Oldham and Saddleworth | Paul Errock | 2 | 1,606 | 0.0 | ||||||||||
| Independent Network | Ian Stephens | 1 | 1,542 | 0.0 | ||||||||||
| Gwlad Gwlad | Gwyn Wigley Evans | 3 | 1,515 | 0.0 | ||||||||||
| Cynon Valley | Andrew Chainey | 1 | 1,322 | 0.0 | ||||||||||
| Veterans and People's | Robin Horsfall | 2 | 1,219 | 0.0 | ||||||||||
| Burnley and Padiham Party | Mark Payne | 1 | 1,162 | 0.0 | ||||||||||
| Shropshire Party | Robert Jones | 1 | 1,141 | 0.0 | ||||||||||
| Putting Cumbria First | Jonathan Davies | 1 | 1,070 | 0.0 | ||||||||||
| Peace | John Morris | 2 | 960 | 0.0 | ||||||||||
| Wycombe Independents | Matt Knight | 1 | 926 | 0.0 | ||||||||||
| Justice & Anti-Corruption | Donald Jerrard | 3 | 728 | 0.0 | ||||||||||
| Christian | Jeff Green | 2 | 705 | 0.0 | 0.0 | |||||||||
| Renew | Julie Girling | 4 | 545 | 0.0 | 0.0 | |||||||||
| Workers Revolutionary | Joshua Ogunleye | 5 | 524 | 0.0 | 0.0 | |||||||||
| BNP | Adam Walker | 1 | 510 | 0.0 | 0.0 | |||||||||
| Parties with less than 500 votes each | 1 | |||||||||||||
| Blank and invalid votes | — | — | ||||||||||||
| Total | 3429 | 650 | 0 | 100 | 32,014,110 | 100 | 0.0 | |||||||
| Registered voters, and turnout | 47,587,254 | 67.3 | −1.5 | |||||||||||
References
- "Election Data 1997". Electoral Calculus. Archived from the original on 15 October 2011. Retrieved 18 October 2015.
- "BBC NEWS>VOTE 2001>Results and Constituencies>Clwyd South". Vote 2001. BBC News. 1 May 1997. Retrieved 17 February 2020.
- Ask Aristotle: Henley, guardian.co.uk
- "Election Data 2001". Electoral Calculus. Archived from the original on 15 October 2011. Retrieved 18 October 2015.
- "Election Data 2005". Electoral Calculus. Archived from the original on 15 October 2011. Retrieved 18 October 2015.
- "Election Data 2015". Electoral Calculus. Archived from the original on 17 October 2015. Retrieved 17 October 2015.
- "London Borough of Hillingdon – Uxbridge and South Ruislip constituency results 2015". Government of the United Kingdom. Archived from the original on 5 September 2017. Retrieved 22 April 2018.
- "Uxbridge & Ruislip South parliamentary constituency – Election 2015 – BBC News". BBC.
- "VOTE FOR CHRIS SUMMERS". VOTE FOR CHRIS SUMMERS.
- "Archived copy". Archived from the original on 8 January 2015. Retrieved 25 February 2015.CS1 maint: archived copy as title (link)
- "TUSC parliamentary candidates in May 2015" (PDF). Tusc.org. Retrieved 13 June 2017.
- "Archived copy". Archived from the original on 18 April 2015. Retrieved 10 April 2015.CS1 maint: archived copy as title (link)
- "Monster Raving Loony's Howling Laud Hope's career". BBC. 27 November 2014.
- "Uxbridge & Ruislip South parliamentary constituency". BBC News.
- http://researchbriefings.files.parliament.uk/documents/CBP-7979/CBP-7979.pdf
- This independent candidate left the optional Description field blank on the "Statement of Persons Nominated" (PDF). London Borough of Hillingdon. Retrieved 14 November 2019.
- "2008 election results for the Mayor of London and the London Assembly". London Elects. 2 May 2008. Archived from the original on 3 May 2016. Retrieved 17 February 2013.
- "London Elects - Declared Results". Greater London Authority. 4 May 2012. Archived from the original on 3 May 2016. Retrieved 17 February 2013.
- "Results of the 2019 General Election". BBC News. Retrieved 13 December 2019.
- "General Election 2019: full results and analysis". House of Commons Library. 28 January 2020. Retrieved 1 March 2020.
- Tench, William. "2019 Election Candidates". Retrieved 15 November 2019.
| ||
| Political career | .jpg.webp) .svg.png.webp) | |
| Premiership | ||
| Elections | ||
| Books |
| |
| Cultural depictions |
| |
| Family |
| |
This article is issued from Wikipedia. The text is licensed under Creative Commons - Attribution - Sharealike. Additional terms may apply for the media files.