North Shropshire (UK Parliament constituency)
North Shropshire[n 1] is a constituency[n 2] represented in the House of Commons of the UK Parliament since 1997 by Owen Paterson, a Conservative.[n 3]
| North Shropshire | |
|---|---|
| County constituency for the House of Commons | |
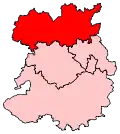 Boundary of North Shropshire in Shropshire | |
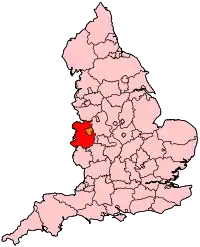 Location of Shropshire within England | |
| County | Shropshire |
| Electorate | 77,673 (December 2010) |
| Major settlements | Wem, Whitchurch, Ellesmere, Oswestry, and Market Drayton |
| Current constituency | |
| Created | 1983 |
| Member of Parliament | Owen Paterson (Conservative) |
| Number of members | One |
| Created from | Oswestry and Wrekin[1] |
| 1832–1885 | |
| Number of members | Two |
| Replaced by | Oswestry Wellington Newport |
History
From its first creation in 1832 to the abolition of the first creation in 1885 it covered approximately half of the county and elected two members, formally Knights of the Shire. In 1885 the county was (together with South Shropshire) - divided between four constituencies: Ludlow, Newport, Oswestry and Wellington.
In 1983 the constituency was revived in a smaller form and elects one Member of Parliament (MP) by the first past the post system of election.
Owen Paterson was appointed to be the Secretary of State for Northern Ireland in May 2010 and from the September 2012 Cabinet reshuffle, Secretary of State for Environment, Food and Rural Affairs,[2] until another reshuffle in June 2014.
Boundaries
1832–1885: The Hundreds of Oswestry, Pimhill, North Bradford and South Bradford, and the Liberty of Shrewsbury.[3]
1983–1997: The District of North Shropshire, the Borough of Oswestry, and the District of The Wrekin wards of Church Aston, Edgmond, Ercall Magna, Newport East, Newport North, and Newport West.
1997–2009: The District of North Shropshire, and the Borough of Oswestry.
2009–present: The North Area Committee of Shropshire Council.
The area is rural and north of Shrewsbury, west of Newcastle-under-Lyme in the Stoke conurbation and south of Cheshire, having five small towns.
Members of Parliament
MPs 1832–85
- Constituency created in 1832
| Election | First member[4] | First party | Second member[4] | Second party | ||
|---|---|---|---|---|---|---|
| 1832 | Sir Rowland Hill, Bt | Tory[5][6][7] | John Cotes | Whig[5][6][7] | ||
| 1834 | Conservative[5] | |||||
| 1835 | William Ormsby-Gore | Conservative[5] | ||||
| 1843 by-election | Viscount Clive | Conservative[5] | ||||
| 1848 by-election | John Whitehall Dod | Conservative | ||||
| 1857 | Hon. Rowland Hill | Conservative | ||||
| 1859 | John Ormsby-Gore | Conservative | ||||
| 1865 | Hon. Charles Cust | Conservative | ||||
| 1866 by-election | Hon. Adelbert Brownlow-Cust | Conservative | ||||
| 1867 by-election | Viscount Newport | Conservative | ||||
| 1876 by-election | Stanley Leighton | Conservative | ||||
| 1885 | Constituency abolished | |||||
MPs since 1983
| Election | Member[4] | Party | |
|---|---|---|---|
| 1983 | John Biffen | Conservative | |
| 1997 | Owen Paterson | Conservative | |
Elections
Elections in the 2010s
| Party | Candidate | Votes | % | ±% | |
|---|---|---|---|---|---|
| Conservative | Owen Paterson | 35,444 | 62.7 | ||
| Labour | Graeme Currie | 12,495 | 22.1 | ||
| Liberal Democrats | Helen Morgan | 5,643 | 10.0 | ||
| Green | John Adams | 1,790 | 3.2 | ||
| Shropshire Party | Robert Jones | 1,141 | 2.0 | N/A | |
| Majority | 22,949 | 40.6 | |||
| Turnout | 56,513 | 67.9 | |||
| Conservative hold | Swing | ||||
| Party | Candidate | Votes | % | ±% | |
|---|---|---|---|---|---|
| Conservative | Owen Paterson | 33,642 | 60.5 | ||
| Labour | Graeme Currie | 17,287 | 31.1 | ||
| Liberal Democrats | Tom Thornhill | 2,948 | 5.3 | ||
| Green | Duncan Kerr | 1,722 | 3.1 | ||
| Majority | 16,355 | 29.4 | |||
| Turnout | 55,599 | 69.0 | |||
| Conservative hold | Swing | ||||
| Party | Candidate | Votes | % | ±% | |
|---|---|---|---|---|---|
| Conservative | Owen Paterson | 27,041 | 51.5 | ||
| Labour | Graeme Currie | 10,457 | 19.9 | ||
| UKIP | Andrea Allen[11] | 9,262 | 17.6 | ||
| Liberal Democrats | Tom Thornhill | 3,184 | 6.0 | ||
| Green | Duncan Kerr[12] | 2,575 | 4.9 | ||
| Majority | 16,584 | 31.6 | |||
| Turnout | 52,483 | 67.6 | |||
| Conservative hold | Swing | ||||
Class War originally selected Al Derby as a candidate here, but he changed to Wolverhampton North East.[13]
| Party | Candidate | Votes | % | ±% | |
|---|---|---|---|---|---|
| Conservative | Owen Paterson | 26,692 | 51.5 | ||
| Liberal Democrats | Ian Croll | 10,864 | 20.9 | ||
| Labour | Ian McLaughlan | 9,406 | 18.1 | ||
| UKIP | Sandra List | 2,432 | 4.7 | ||
| BNP | Phil Reddall | 1,667 | 3.2 | ||
| Green | Steve Boulding | 808 | 1.6 | ||
| Majority | 15,828 | 30.6 | |||
| Turnout | 51,869 | 65.7 | |||
| Conservative hold | Swing | ||||
Elections in the 2000s
| Party | Candidate | Votes | % | ±% | |
|---|---|---|---|---|---|
| Conservative | Owen Paterson | 23,061 | 49.6 | +1.0 | |
| Labour | Sandra Samuels | 12,041 | 25.9 | −9.3 | |
| Liberal Democrats | Steve Bourne | 9,175 | 19.7 | +6.9 | |
| UKIP | Ian Smith | 2,233 | 4.8 | +2.3 | |
| Majority | 11,020 | 23.7 | |||
| Turnout | 46,510 | 61.4 | −1.7 | ||
| Conservative hold | Swing | +5.1 | |||
| Party | Candidate | Votes | % | ±% | |
|---|---|---|---|---|---|
| Conservative | Owen Paterson | 22,631 | 48.6 | +8.4 | |
| Labour | Mike Ion | 16,390 | 35.2 | -0.8 | |
| Liberal Democrats | Ben Jephcott | 5,945 | 12.8 | -7.6 | |
| UKIP | David Trevanion | 1,165 | 2.5 | ||
| Independent | Russell Maxfield | 389 | 0.8 | ||
| Majority | 6,241 | 13.4 | |||
| Turnout | 46,520 | 63.1 | -9.5 | ||
Elections in the 1990s
| Party | Candidate | Votes | % | ±% | |
|---|---|---|---|---|---|
| Conservative | Owen Paterson | 20,730 | 40.24 | ||
| Labour | Ian Lucas | 18,535 | 35.98 | ||
| Liberal Democrats | John Stevens | 10,489 | 20.36 | ||
| Referendum | Denis Allen | 1,764 | 3.42 | ||
| Majority | 2,195 | 4.26 | |||
| Turnout | 72.59 | ||||
| Conservative hold | Swing | ||||
| Party | Candidate | Votes | % | ±% | |
|---|---|---|---|---|---|
| Conservative | John Biffen | 32,443 | 50.5 | −1.7 | |
| Liberal Democrats | John Stevens | 16,232 | 25.3 | −2.2 | |
| Labour | Bob Hawkins | 15,550 | 24.2 | +3.8 | |
| Majority | 16,211 | 25.2 | +0.5 | ||
| Turnout | 64,225 | 77.7 | +2.2 | ||
| Conservative hold | Swing | +0.2 | |||
Elections in the 1980s
| Party | Candidate | Votes | % | ±% | |
|---|---|---|---|---|---|
| Conservative | John Biffen | 30,385 | 52.19 | ||
| Liberal | Gordon Smith | 15,970 | 27.43 | ||
| Labour | Bob Hawkins | 11,866 | 20.38 | ||
| Majority | 14,415 | 24.76 | |||
| Turnout | 75.49 | ||||
| Conservative hold | Swing | ||||
| Party | Candidate | Votes | % | ±% | |
|---|---|---|---|---|---|
| Conservative | John Biffen | 28,496 | 53.44 | ||
| Liberal | David Evans | 16,829 | 31.56 | ||
| Labour | Helen Jones | 7,860 | 14.74 | ||
| Independent For Referendum | JL Phillimore | 135 | 0.25 | ||
| Majority | 11,667 | 21.88 | |||
| Turnout | 72.71 | ||||
| Conservative win (new seat) | |||||
Elections in the 1880s
| Party | Candidate | Votes | % | ±% | |
|---|---|---|---|---|---|
| Conservative | Stanley Leighton | Unopposed | |||
| Conservative | George Bridgeman | Unopposed | |||
| Registered electors | 7,729 | ||||
| Conservative hold | |||||
| Conservative hold | |||||
Elections in the 1870s
| Party | Candidate | Votes | % | ±% | |
|---|---|---|---|---|---|
| Conservative | Stanley Leighton | 2,737 | 50.3 | N/A | |
| Conservative | Salusbury Kynaston Mainwaring[24] | 2,700 | 49.7 | N/A | |
| Majority | 37 | 0.7 | N/A | ||
| Turnout | 5,437 | 74.1 | N/A | ||
| Registered electors | 7,342 | ||||
| Conservative hold | |||||
- Caused by Gore's elevation to the peerage, becoming Lord Harlech.
| Party | Candidate | Votes | % | ±% | |
|---|---|---|---|---|---|
| Conservative | John Ormsby-Gore | Unopposed | |||
| Conservative | George Bridgeman | Unopposed | |||
| Registered electors | 7,557 | ||||
| Conservative hold | |||||
| Conservative hold | |||||
Elections in the 1860s
| Party | Candidate | Votes | % | ±% | |
|---|---|---|---|---|---|
| Conservative | John Ormsby-Gore | 3,602 | 38.2 | N/A | |
| Conservative | George Bridgeman | 3,403 | 36.1 | N/A | |
| Liberal | Richard George Jebb[25] | 2,412 | 25.6 | N/A | |
| Majority | 991 | 10.5 | N/A | ||
| Turnout | 5,915 (est) | 77.7 (est) | N/A | ||
| Registered electors | 7,611 | ||||
| Conservative hold | |||||
| Conservative hold | |||||
| Party | Candidate | Votes | % | ±% | |
|---|---|---|---|---|---|
| Conservative | George Bridgeman | Unopposed | |||
| Conservative hold | |||||
- Caused by Brownlow-Cust's elevation to the peerage, becoming 3rd Earl Brownlow.
| Party | Candidate | Votes | % | ±% | |
|---|---|---|---|---|---|
| Conservative | Adelbert Brownlow-Cust | Unopposed | |||
| Conservative hold | |||||
- Caused by Cust's resignation.
| Party | Candidate | Votes | % | ±% | |
|---|---|---|---|---|---|
| Conservative | John Ormsby-Gore | Unopposed | |||
| Conservative | Charles Cust | Unopposed | |||
| Registered electors | 5,315 | ||||
| Conservative hold | |||||
| Conservative hold | |||||
Elections in the 1850s
| Party | Candidate | Votes | % | ±% | |
|---|---|---|---|---|---|
| Conservative | John Ormsby-Gore | Unopposed | |||
| Conservative | Rowland Hill | Unopposed | |||
| Registered electors | 4,110 | ||||
| Conservative hold | |||||
| Conservative hold | |||||
| Party | Candidate | Votes | % | ±% | |
|---|---|---|---|---|---|
| Conservative | John Whitehall Dod | Unopposed | |||
| Conservative | Rowland Hill | Unopposed | |||
| Registered electors | 4,227 | ||||
| Conservative hold | |||||
| Conservative hold | |||||
| Party | Candidate | Votes | % | ±% | |
|---|---|---|---|---|---|
| Conservative | John Whitehall Dod | Unopposed | |||
| Conservative | William Ormsby-Gore | Unopposed | |||
| Registered electors | 4,685 | ||||
| Conservative hold | |||||
| Conservative hold | |||||
Elections in the 1840s
| Party | Candidate | Votes | % | ±% | |
|---|---|---|---|---|---|
| Conservative | John Whitehall Dod | Unopposed | |||
| Conservative hold | |||||
- Caused by Herbert's succession to the peerage, becoming 3rd Earl of Powis
| Party | Candidate | Votes | % | ±% | |
|---|---|---|---|---|---|
| Conservative | Edward Herbert | Unopposed | |||
| Conservative | William Ormsby-Gore | Unopposed | |||
| Registered electors | 4,876 | ||||
| Conservative hold | |||||
| Conservative hold | |||||
| Party | Candidate | Votes | % | ±% | |
|---|---|---|---|---|---|
| Conservative | Edward Herbert | Unopposed | |||
| Registered electors | 4,876 | ||||
| Conservative hold | |||||
- Caused by Hill's succession to the peerage, becoming 2nd Viscount Hill
| Party | Candidate | Votes | % | ±% | |
|---|---|---|---|---|---|
| Conservative | Rowland Hill | Unopposed | |||
| Conservative | William Ormsby-Gore | Unopposed | |||
| Registered electors | 5,075 | ||||
| Conservative hold | |||||
| Conservative hold | |||||
Elections in the 1830s
| Party | Candidate | Votes | % | ||
|---|---|---|---|---|---|
| Conservative | Rowland Hill | Unopposed | |||
| Conservative | William Ormsby-Gore | Unopposed | |||
| Registered electors | 4,910 | ||||
| Conservative hold | |||||
| Conservative hold | |||||
| Party | Candidate | Votes | % | ||
|---|---|---|---|---|---|
| Conservative | Rowland Hill | Unopposed | |||
| Conservative | William Ormsby-Gore | Unopposed | |||
| Registered electors | 4,653 | ||||
| Conservative hold | |||||
| Conservative gain from Whig | |||||
| Party | Candidate | Votes | % | ||
|---|---|---|---|---|---|
| Tory | Rowland Hill | 2,981 | 41.7 | ||
| Whig | John Cotes | 2,117 | 29.6 | ||
| Tory | William Ormsby-Gore | 2,045 | 28.6 | ||
| Turnout | 4,296 | 91.8 | |||
| Registered electors | 4,682 | ||||
| Majority | 864 | 12.1 | |||
| Tory win (new seat) | |||||
| Majority | 72 | 1.0 | |||
| Whig win (new seat) | |||||
Notes and references
- Notes
- (Historically also Shropshire North and The Northern Division of Shropshire)
- A county constituency (for the purposes of election expenses and type of returning officer)
- As with all constituencies, the constituency elects one Member of Parliament (MP) by the first past the post system of election at least every five years.
- References
- "'Shropshire North', June 1983 up to May 1997". ElectionWeb Project. Cognitive Computing Limited. Retrieved 14 March 2016.
- "David Cameron's right turn in cabinet reshuffle". The Guardian. 4 September 2012.
- "The statutes of the United Kingdom of Great Britain and Ireland. 2 & 3 William IV. Cap. LXIV. An Act to settle and describe the Divisions of Counties, and the Limits of Cities and Boroughs, in England and Wales, in so far as respects the Election of Members to serve in Parliament". London: His Majesty's statute and law printers. 1832. pp. 300–383. Retrieved 2017-07-27.
- Leigh Rayment's Historical List of MPs – Constituencies beginning with "S" (part 3)
- Stooks Smith, Henry (1845). The Parliaments of England, from 1st George I., to the Present Time. Vol II: Oxfordshire to Wales Inclusive. London: Simpkin, Marshall, & Co. pp. 15–16. Retrieved 27 May 2019 – via Google Books.
- "York Herald". 22 December 1832. p. 2. Retrieved 27 May 2019 – via British Newspaper Archive.
- "Result of the Elections in Shropshire". Morning Post. 24 December 1832. p. 2. Retrieved 27 May 2019 – via British Newspaper Archive.
- "Shropshire North parliamentary constituency - Election 2019". Retrieved 2019-12-15.
- "Shrewsbury & Atcham Parliamentary constituency". BBC News.
- "Election Data 2015". Electoral Calculus. Archived from the original on 17 October 2015. Retrieved 17 October 2015.
- "UK Polling Report". ukpollingreport.co.uk.
- "Candidates announced". shrewsburynorthshropshire.greenparty.org.uk.
- "Al Derby". Who Can I Vote For? by Democracy Club.
- "Election Data 2010". Electoral Calculus. Archived from the original on 26 July 2013. Retrieved 17 October 2015.
- web.manager@shropshire.gov.uk. "Democracy – Shropshire Council" (PDF). www.shropshire.gov.uk.
- "Election Data 2005". Electoral Calculus. Archived from the original on 15 October 2011. Retrieved 18 October 2015.
- "Election Data 2001". Electoral Calculus. Archived from the original on 15 October 2011. Retrieved 18 October 2015.
- "Election Data 1997". Electoral Calculus. Archived from the original on 15 October 2011. Retrieved 18 October 2015.
- "Election Data 1992". Electoral Calculus. Archived from the original on 15 October 2011. Retrieved 18 October 2015.
- "Politics Resources". Election 1992. Politics Resources. 9 April 1992. Archived from the original on 24 July 2011. Retrieved 2010-12-06.
- "Election Data 1987". Electoral Calculus. Archived from the original on 15 October 2011. Retrieved 18 October 2015.
- "Election Data 1983". Electoral Calculus. Archived from the original on 15 October 2011. Retrieved 18 October 2015.
- Craig, F. W. S., ed. (1977). British Parliamentary Election Results 1832-1885 (e-book)
|format=requires|url=(help) (1st ed.). London: Macmillan Press. pp. 446–447. ISBN 978-1-349-02349-3. - "North Shropshire". York Herald. 7 January 1876. p. 6. Retrieved 19 January 2018 – via British Newspaper Archive.
- "North Shropshire Election". Wellington Journal. 14 November 1868. p. 4. Retrieved 17 March 2018 – via British Newspaper Archive.
Sources
- UK Polling Report
- Craig, F. W. S. (1989) [1977]. British parliamentary election results 1832–1885 (2nd ed.). Chichester: Parliamentary Research Services. pp. 446–447. ISBN 0-900178-26-4.