Electricity sector in Australia
The electricity sector in Australia is historically dominated by coal-fired power stations, but renewables are forming a rapidly growing fraction of supply.
.png.webp)
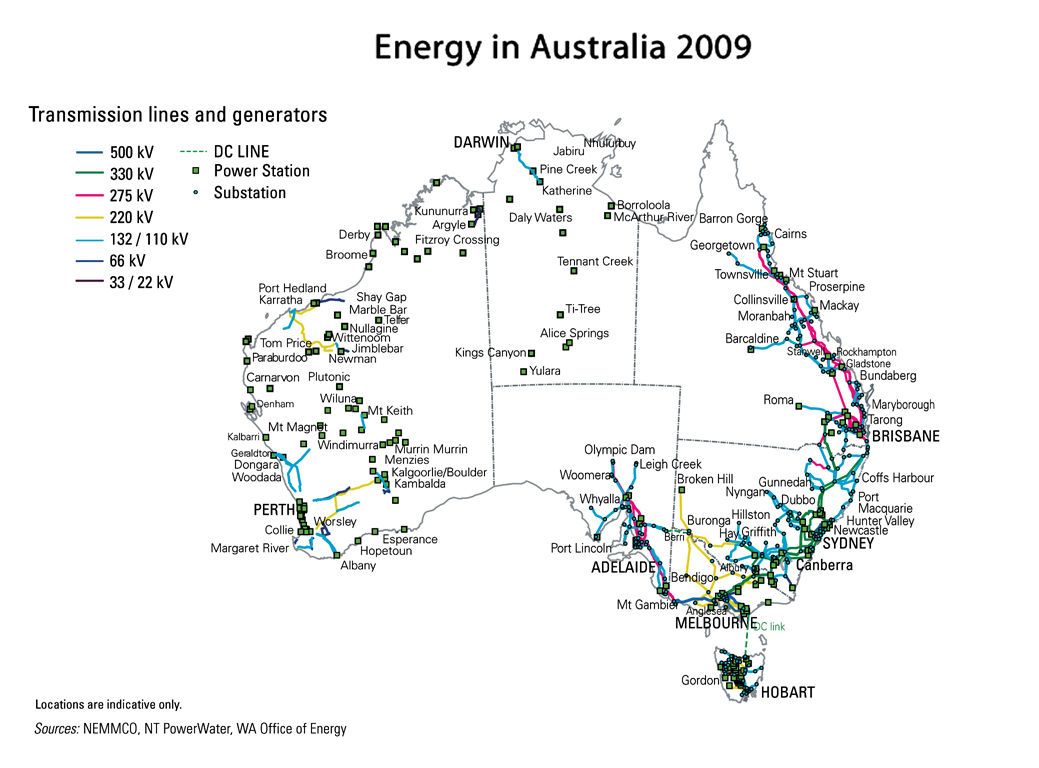
Due to its large size and the location of its population, Australia lacks a single grid that covers all states, but has a transmission grid that extends along the east coast from Queensland via New South Wales and Victoria to South Australia and also connects via submarine DC cable with Tasmania.[1]
Since 2005, wind power and rooftop solar have led to a fast growing share of renewable energy in total electricity generation.[2]
Statistical Summary
Overview of Electrical Energy Supply in the National Electricity Market[2]
Percentages of installed capacity (power in GW) and electricity production in (energy in TWh), "other dispatched" not included.
| Year | Coal (%) | Gas (%) | Hydro (%) | Wind (%) | Solar (%) | |||||
|---|---|---|---|---|---|---|---|---|---|---|
| Year | pow | en | pow | en | pow | en | pow | en | pow | en |
| 2009-10 | 58 | 81 | 21 | 10 | 16 | 6 | 3 | 2 | - | - |
| 2010-11 | 56 | 78 | 21 | 12 | 16 | 8 | 4 | 3 | - | - |
| 2011-12 | 57 | 79 | 21 | 11 | 16 | 7 | 4 | 3 | 3 | 0.9 |
| 2012-13 | 55 | 75 | 20 | 12 | 17 | 9 | 5.4 | 3.4 | 5.6 | 1.3 |
| 2013-14 | 53 | 74 | 21 | 12 | 16 | 9 | 6.3 | 4.1 | 6.4 | 2 |
| 2014-15 | 54 | 76 | 20 | 12 | 16 | 7 | 6.6 | 4.9 | 8 | 2.7 |
| 2015-16 | 52 | 76 | 19 | 7 | 17 | 10 | 7.5 | 6.1 | 9 | 3 |
| 2017-18 | 40.9 | 72.3 | 21.3 | 9.5 | 14.3 | 7.4 | 9.1 | 6.4 | 12.8 | 3.8 |
| 2019 | 37.3 | 68.1 | 16.1 | 8.7 | 13.2 | 6.7 | 10.0 | 8.2 | 20.0 | 7.7 |
Electricity generation by fuel source in the National Electricity Market[3]
"Solar" includes rooftop solar and solar farms, "other dispatched" (max 1.2 TWh) and "battery storage" (max 70 GWh) not included.
| Year | Black Coal | Brown Coal | Natural Gas | Hydro | Wind | Solar | SUM | |||||||
|---|---|---|---|---|---|---|---|---|---|---|---|---|---|---|
| Year | GW | TWh | GW | TWh | GW | TWh | GW | TWh | GW | TWh | GW | TWh | GW | TWh |
| 2006 | 121.8 | 56.1 | 12.7 | 14.9 | 1.1 | 0.0 | 206.6 | |||||||
| 2007 | 120.5 | 55.2 | 19.4 | 13.2 | 1.5 | 0.0 | 209.7 | |||||||
| 2008 | 123.1 | 56.1 | 17.9 | 11.7 | 2.4 | 0.0 | 211.2 | |||||||
| 2009 | 116.9 | 56.3 | 19.3 | 12.3 | 3.8 | 0.0 | 208.7 | |||||||
| 2010 | 108.7 | 55.9 | 23.6 | 15.8 | 4.8 | 0.2 | 208.6 | |||||||
| 2011 | 108.4 | 54.6 | 23.0 | 13.4 | 5.7 | 0.7 | 205.8 | |||||||
| 2012 | 102.7 | 50.8 | 24.5 | 16.0 | 6.4 | 1.7 | 202.0 | |||||||
| 2013 | 98.6 | 47.3 | 22.6 | 18.6 | 8.0 | 3.0 | 198.0 | |||||||
| 2014 | 96.1 | 49.2 | 25.0 | 13.9 | 8.5 | 4.0 | 196.7 | |||||||
| 2015 | 100.9 | 50.6 | 19.9 | 13.4 | 10.0 | 5.2 | 200.0 | |||||||
| 2016 | 104.1 | 47.0 | 16.2 | 17.1 | 11.2 | 6.6 | 202.1 | |||||||
| 2017 | 110.0 | 38.3 | 21.4 | 12.9 | 11.4 | 7.4 | 201.4 | |||||||
| 2018 | 110.3 | 36.0 | 15.5 | 16.7 | 14.3 | 10.0 | 202.9 | |||||||
| 2019 | 18.0 | 106.8 | 4.6 | 33.3 | 9.8 | 18.0 | 8.1 | 13.7 | 6.1 | 16.9 | 12.2 | 15.8 | 58.9 | 204.5 |
Electricity supply
As of 2011, electricity producers in Australia were not building gas-fired power stations,[4] while the four major banks were unwilling to make loans for coal-fired power stations, according to EnergyAustralia (formerly TRUenergy).[5] In 2014, an oversupply of generation was expected to persist until 2024.[6] However, a report published in 2017 by the Australian Energy Market Operator projected that energy supply in 2018 and 2019 is expected to meet demands, with a risk of supply falling short at peak demand times.[7]
From 2003 to 2013 real electric prices for households increased by an average of 72%. Much of this increase in price has been attributed to over-investment in increasing distribution networks and capacity, and environmental policy impacts. Further price increases are predicted to be moderate over the next few years (2017 on) due to changes in the regulation of transmission and distribution networks as well as increased competition in electricity wholesale markets as supply and demand merge.[8]
Privatization
Since the 1990s the electricity sector in Australia has seen a wave of privatization. First in South Australia in 1999, then in Victoria in the late 1990s, then in New South Wales in the early 2010s.
In 2006, the Queensland Government announced plans to privatise the retail arm of Energex and its Allgas distribution network.
Renewable
Renewable energy has potential in Australia, and the Climate Change Authority is reviewing the 20-percent Renewable Energy Target (RET). The production of 50 megawatts of wind power (power for nearly 21,000 homes annually) creates about 50 construction jobs and five staff positions.[9][10] In recent years, wind and solar power have been the fastest growing source of energy in Australia.
Renewable electricity in Australia is available from a number of green energy suppliers that supply electricity from environmentally friendly energy sources that are renewable and non-polluting. The growth and development of the green energy industry was tracked in Australia by the ALTEX-Australia alternative energy index from 2006 to 2011.
In Australia renewable energy is accredited under the GreenPower scheme whereby all distributors are government audited bi-annually to ensure that customers are getting exactly what is described in their purchased products. In the 2009 settlement period there were 904,716 GreenPower customers Australia-wide, accounting for a total of 2,194,934 MWh of electricity generation, a 10% increase over 2008. This total electricity provision was divided between residential customers who purchased 1,001,195 MWh, and business customers who purchased 1,193,739 MWh.[11][12] The largest nationwide distributors were EnergyAustralia, Origin Energy, and TRUenergy.
By the 2014 settlement period the number of GreenPower customers Australia-wide was at 497,406, and total purchases accounted for 1,279,281 MWh.[13]
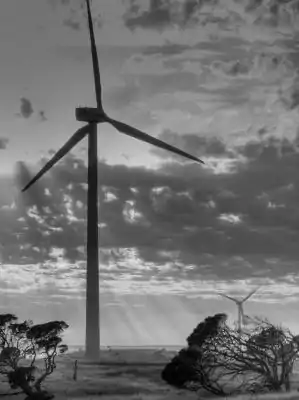
Wind power
Wind power is a mode of production of renewable energy in Australia. Wind power is a rapidly expanding mode of renewable energy production in Australia with an average annual rate of growth in installed capacity of 35% over the five years up to 2011. As of December 2017, there were 4,455 megawatts (MW) of installed capacity and a further 18,823 MW of capacity was proposed or committed.[14] In 2016, wind power accounted for 5.3% of Australia's total electricity demand and 30.8% of total renewable energy supply.[15] At the end of 2016 there were 79 wind farms in Australia, most of which had turbines from 1.5 to 3 MW.[15][16] In addition, 16 projects with a combined installed capacity of 1,861 MW are either under construction, constructed or will start construction in 2017 having reached financial closure. [17]
Wind power in South Australia has 36.9% of Australia's wind power capacity, accounting for 40% of the state's electricity needs as of 2016 and the first year in which wind power was the leading source of electricity in the state.[18] By the end of 2011 wind power in South Australia reached 26% of the State's electricity generation, edging out coal-fired power for the first time. At that stage South Australia, with only 7.2% of Australia's population, had 54% of Australia's installed wind capacity.
Victoria also has a substantial system, with just under 30% of the Australia's capacity as of 2016.[15] In August 2015, the Victorian government announced financial backing for new wind farms as part of a push to encourage renewable energy in the state, which was expected to bring forward the building of a modest 100 MW of new wind energy in the state, worth $200 million in investment. The government expected that there were about 2400 MW worth of Victorian projects that had been approved but were yet to be built.[19]
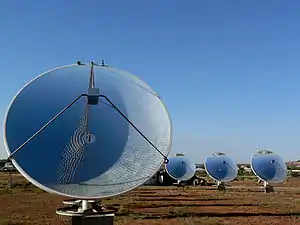
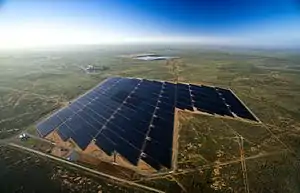
Solar power in Australia
Solar power in Australia is a growing industry. As of December 2017, Australia had over 7,024 MW of installed photovoltaic (PV) solar power,[20] of which 1,190 MW were installed in the preceding 12 months. In 2017, 23 solar PV projects with a combined installed capacity of 2,034 MW were either under construction, constructed or due to start construction having reached financial closure.[17] PV accounted for 2.4% of Australia's electrical energy production in 2014/15.[21]
Feed-in tariffs and renewable energy targets designed to assist renewable energy commercialisation in Australia have largely been responsible for the rapid increase. In South Australia, a solar feed-in tariff was introduced for households and an educational program that involved installing PVs on the roofs of major public buildings such as the Adelaide Airport, State Parliament, Museum, Art Gallery and several hundred public schools.[22] In 2008 Premier Mike Rann announced funding for $8 million worth of solar panels on the roof of the new Goyder Pavilion at the Royal Adelaide Showgrounds, the largest rooftop solar installation in Australia, qualifying it for official "power station" status.[23] South Australia has the highest per capita take up of household solar power in Australia.
The installed PV capacity in Australia has increased 10-fold between 2009 and 2011, and quadrupled between 2011 and 2016. The first commercial-scale PV power plant, the 1 MW Uterne Solar Power Station, was opened in 2011.[24] Greenough River Solar Farm opened in 2012 with a capacity of 10 MW.[25] The price of photovoltaics has been decreasing, and in January 2013, was less than half the cost of using grid electricity in Australia.[26]
Australia has been internationally criticised for producing very little of its energy from solar power, despite its vast resources, extensive sunshine and overall high potential.[27][28][29][30][31]
Storage
Battery
Some parts of the Australian grid are thinly connected and local outages have been common.
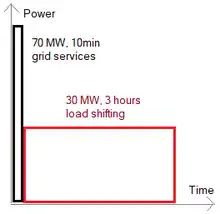
In Southern Australia a battery installation was performed to keep the local grid running until backup power could be bought on line. the Hornsdale Power Reserve is a grid-connected energy storage system co-located with the Hornsdale Wind Farm in the Mid North region of South Australia. It is promoted as the largest lithium-ion battery in the world.[32]
During 2017 Tesla, Inc. won the contract and built the Hornsdale Power Reserve, for a capital cost of A$90 million, leading to the colloquial Tesla big battery name.[33][34][35]
In November 2019, Neoen confirmed that it was increasing capacity by a further 50MW/64.5MWh[36][37][38] to a combined 185 MWh. The increased storage capacity was installed by March 23, 2020, and the increased power will follow later in the year.[39]
National Electricity Market
The National Electricity Market (NEM) is an arrangement in Australia for the connection of the synchronous electricity transmission grids of the eastern and southern Australia states and territories to create a cross-state wholesale electricity market.[40] The Australian Energy Market Commission develops and maintains the Australian National Electricity Rules (NER), which have the force of law in the states and territories participating in NEM. The Rules are enforced by the Australian Energy Regulator. The day-to-day management of NEM is performed by the Australian Energy Market Operator.
The NEM began operation on 13 December 1998 and operations currently includes Queensland, New South Wales, Australian Capital Territory, Victoria, Tasmania and South Australia.[40] Western Australia and the Northern Territory are not connected to the NEM.[40] The NEM comprises five regions, with the ACT being in the NSW region. Tasmania joined the NEM in May 2005 and became fully operational on 29 April 2006 when the Basslink interconnector was fully activated.[41] The Snowy region was abolished as a region on 1 July 2008 and the components split between New South Wales and Victoria. The Northern Territory has adopted parts of the National Electricity Law, with the Australian Energy Market Commission becoming the rule maker for the Territory for parts of the National Electricity Rules from 1 July 2016.[42] Western Australia is also considering adopting parts of the NER.[42]
The NEM operates the world’s longest interconnected power systems between Port Douglas, Queensland and Port Lincoln, South Australia with an end-to-end distance of more than 5000 kilometres, and 40,000 circuit kilometres. Over A$11 billion of electricity is traded annually in the NEM to meet the demand of almost 19 million end-use consumers.[43][44] New South Wales accounts for about 25% of NEM.
States and territories
Queensland

Queensland, Australia's second largest state in terms of physical area (Western Australia is the largest), achieved the early leaders' dream of providing electricity to every home entailing a considerable degree of pioneering, innovation, and commitment. Queensland proved to be a pioneer in the supply of electricity in Australia, with the first public demonstration in Australia, the first recorded use for public purposes in the country, the first Parliament House in Australia and the first commercial operations in Australia all occurring in Brisbane.
Generation and limited distribution was initially the responsibility of local authorities, until a central state-based authority to coordinate the generation and distribution of electrical power was established in 1938.[45] In the late 1990s, the electricity sector was restructured to enable integration with the National Electricity Market (NEM).
The history of power generation and distribution in Queensland can be considered in three major phases: Initial local generation and distribution; creation of a statewide body and the consequent creation of an extensive network; and the restructure to enable integration with the NEM.
Queensland is the most decentralised mainland state, and initial local generation and distribution was the only viable option for the supply of electricity in many instances. The creation of regional, and then a statewide network from 1945 enabled economies of scale and reliability to be obtained, particularly by generating plants. Within a decade of the statewide network being completed, the establishment of the NEM provided new commercial opportunities for generators and improved reliability of supply.
Victoria
South Australia
South Australia is rich in energy. It contains significant reserves of fossil fuels such as natural gas, coal, and oil – although there are incentives to phase these out in favour of clean energy. The state also contains large amounts of uranium, including the world's single biggest deposit at Olympic Dam, which represents 30% of the world's total resource.[46]
The State has seen a rapid increase in investment in renewable energy, and was the leading producer of wind power in Australia in 2011.[47] South Australia has been noted for the availability of hot rocks suitable for geothermal electricity generation.[48] The South Australian Government has released plans to make South Australia a green energy hub for Australia's eastern seaboard.[49] During 2020, the state set new records for its lowest (379 MW) and highest (2,576 MW) grid power. Prices also fell, and were negative 10% of the time in the third quarter, but by a smaller amount than previously. This mainly occurred in September, when solar farms paid to supply power. Curtailment was 5.5%, mainly in the daytime.[50] In October 2020, South Australia exceeded 100% of the state's electricity demand using solar power for the first time.[51]
Tasmania
A large proportion of Tasmania's power is produced by hydro-electric means. There are also a number of wind farms producing electricity. An underwater power cable, links Tasmania to mainland Australia. This connection was established in 2005. It allows for surplus electricity to be sold into the national grid. Alternatively electricity supply can also be imported if needed. The vast minority of the states power supply is classified as green energy.
Western Australia
Western Australia has its own grid the South West Interconnected System which is not connected to the rest of country due to distance.
Northern Territories
The Northern Territories have multiple grids, which are predominately run by two government owned companies, Power and Water Corporation and Territory Generation.
Energy efficiency
Lower energy use could save A$25 billion, or A$840 per electricity customer, according to EnergyAustralia.[52]
References
- Map of transmission lines and generators in Australia, 2009
- "State of the energy market, May 2017 | Australian Energy Regulator". www.aer.gov.au. Retrieved 2017-07-11. Comparable to previous years statistical calculation criteria, 2019, 2018, 2015, 2014, 2013, 2012, 2011, and 2010
- AER: State of the energy market 2020, Excel Data, Chapter 2 National Electricity Market, Figure 2.5 & Figure 2.6
- (22 May 2011).Carbon tax is delaying investment: McIndoe. Inside Business. Australian Broadcasting Corporation. Retrieved on 12 March 2012.
- Royce Millar & Adam Morton (21 May 2011). Big banks 'no' to coal plant. The Age. Fairfax Media. Retrieved on 12 March 2012.
- Mark, David. "Australia faces unprecedented oversupply of energy, no new energy generation needed for 10 years: report". ABC. Retrieved 7 September 2017.
- "Energy Supply Outlook" (PDF). AEMO. Retrieved 7 September 2017.
- Swoboda, Kai. "Energy prices—the story behind rising costs". Parliament of Australia. Retrieved 12 September 2017.
- scheme (2012).Energy Council
- "Wind Farm Investment, Employment and Carbon Abatement in Australia" (PDF). Archived from the original (PDF) on 2013-04-19. Retrieved 2018-05-01.
- "Latest GreenPower News: GreenPower Audit Report 2009". GreenPower Official Site. ACT, NSW, SA, QLD, VIC and WA State Governments. 18 May 2011. Retrieved 12 June 2011.
- "National GreenPower Accreditation Program: Annual Compliance Audit for 1 January 2009 to 31 December 2009" (PDF). GreenPower Official Website. Perenia Pty Ltd. February 2011. Retrieved 7 June 2011.
- "Latest GreenPower News: GreenPower Audit Report 2014" (PDF). GreenPower Official Site. ACT, NSW, SA, QLD, VIC and WA State Governments. July 2015. Retrieved 14 January 2016.
- "AEMO Planning and Forecasting - General Information Page". Retrieved 3 January 2018.
- "Clean Energy Australia Report 2016" (PDF). Archived from the original (PDF) on 31 July 2017. Retrieved 19 June 2017.
- "Clean Energy Australia Report 2015" (PDF). Archived from the original (PDF) on 18 February 2017. Retrieved 27 November 2016.
- "2017: Biggest year for Australia's Renewable Energy Industry". numerical.co.in. Retrieved 17 April 2018.
- "Clean Energy Australia Report 2015". Retrieved 27 November 2016.
- Arup, Tom (20 August 2015). "Victorian government to back new wind farms as part of renewables plan". The Age. Retrieved 17 April 2018.
- "Australian PV market since April 2001". apvi.org.au.
- "2016 Australian energy statistics update" (PDF). Archived from the original (PDF) on 2018-03-11. Retrieved 2018-05-02.
- Centre for National Policy, What States Can Do: Climate Change Policy, April 4, 2012
- http://www.adelaidenow.com.au/ June 2, 2008. "Adelaide Showgrounds to have nations biggest solar power project"
- "Uterne Solar Power Station". alicesolarcity.com.au. Archived from the original on 25 January 2012.
- Australia's Greenough River Solar Farm Opens Amid Renewable Target Debate, Reuters, Rebekah Kebede, 9 October 2012
- "Solar Electricity Now Under Half The Cost Of Grid Power For Australian Households". CleanTechnica.
- Sunniest places in the world, Current Results.com
- "Is Australia falling out of love with solar power?". BBC News. 5 February 2014. Retrieved 17 August 2014.
- "In Australia, businesses are getting hit with a $500 fee designed to kill solar power". ThinkProgress. 15 August 2014. Retrieved 17 August 2014.
- "US solar giant quits Australia". Renew Economy. Archived from the original on 19 August 2014. Retrieved 17 August 2014.
- Byrnes, L.; Brown, C.; Foster, J.; Wagner, L. (December 2013). "Australian renewable energy policy: Barriers and challenges". Renewable Energy. 60: 711–721. doi:10.1016/j.renene.2013.06.024.
- "Hornsdale Power Reserve". Retrieved 4 December 2017.
- "Revealed: True cost of Tesla big battery, and its government contract". Retrieved 2019-12-19.
- "Tesla completes its giant Australian Powerpack battery on time". Engadget. Retrieved 2018-08-07.
- Elon Musk [@elonmusk] (9 March 2017). "Tesla will get the system installed and working 100 days from contract signature or it is free. That serious enough for you?" (Tweet) – via Twitter.
- Parkinson, Giles (19 November 2019). "Tesla big battery adds new capacity and services on march to 100pct renewables grid". RenewEconomy.
- Harmens, Nicholas. "South Australia's giant Tesla battery output and storage set to increase by 50 per cent".
- Gottfried Cyber Trucker [@GottfriedWebst1] (Nov 7, 2019). "Stop stop. I want those Tesla power packs" (Tweet) – via Twitter.
- "Expansion progress update". hornsdalepowerreserve.com.au (Press release). 2020-05-03.
- National Electricity Market
- "Power flows through Basslink. 29/04/2006. ABC News Online". Archived from the original on 2010-02-13. Retrieved 2018-05-02.
- AEMC becomes electricity rule maker for the Northern Territory on 1 July 2016
- An Introduction to Australia's National Electricity Market "Archived copy" (PDF). Archived from the original (PDF) on 2011-03-11. Retrieved 2010-12-15.CS1 maint: archived copy as title (link)
- Pivotal to Australia's Energy Future.
- Carver, S.R. (1956). Official Year Book of the Commonwealth of Australia. Canberra: Commonwealth Bureau of Census and Statistics. p. 407.
- Uranium 2009: Resources, Production and Demand. Paris, France: International Atomic Energy Agency (IAEA). OECD. 2010. p. 456. ISBN 978-92-64-04789-1.
- "Wind Energy - How it works". Clearenergycouncil. Archived from the original on 21 June 2011. Retrieved 6 October 2011.
- "Clean energy grid for solar australia". The Greens. Greens.org. 17 August 2010. Archived from the original on 30 March 2012. Retrieved 5 October 2011.
- "South Australia to become green energy hub". West Australian Publishers. 21 August 2009. Retrieved 1 December 2012.
- "Quarterly Energy Dynamics (QED)". aemo.com.au. 22 October 2020. pp. 8, 10, 12, 20, 27. Retrieved 27 October 2020.
- https://reneweconomy.com.au/solar-meets-100-per-cent-of-south-australia-demand-for-first-time-78279/
- "Australia's largest solar farm opens amid renewable target debate". The Guardian. 10 October 2012.
The Greenough River Solar project in Western Australia is expected to have enough capacity to power 3,000 homes.
| Fossil Fuel Industry | |
|---|---|
| Renewable Energy Industry | |
| Policies and Targets | |
| Nuclear power | |
| Agencies |
|
| Research | |
| Other topics | |
| |