Fareham (UK Parliament constituency)
Fareham is a constituency[n 1] represented in the House of Commons of the UK Parliament. Since 2015, it has been represented by Suella Braverman of the Conservative Party. She is currently the Attorney General. [n 2]
| Fareham | |
|---|---|
| County constituency for the House of Commons | |
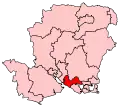 Boundary of Fareham in Hampshire | |
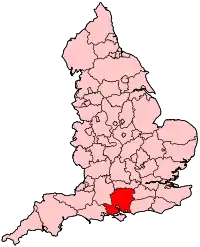 Location of Hampshire within England | |
| County | Hampshire |
| Electorate | 76,457 (December 2010)[1] |
| Major settlements | Fareham, Portchester, Warsash |
| Current constituency | |
| Created | 1974 |
| Member of Parliament | Suella Braverman (Conservative) |
| Number of members | One |
| Created from | Gosport & Fareham |
| 1885–1950 | |
| Number of members | One |
| Type of constituency | County constituency |
| Replaced by | Gosport & Fareham and Portsmouth Langstone |
| Created from | South Hampshire |
Boundaries
1885–1918: The Municipal Boroughs of Portsmouth and Southampton, the Sessional Division of Fareham, and part of the Sessional Division of Southampton.
1918–1950: The Urban Districts of Fareham, Gosport and Alverstoke, Havant, and Warblington, and the Rural Districts of Fareham and Havant.
1974–1983: The Urban District of Fareham.
1983–1997: The Borough of Fareham except the wards of Hill Head and Stubbington, and the City of Winchester wards of Boarhunt and Southwick, Curdridge, Denmead, Droxford Soberton and Hambledon, Shedfield, Swanmore, Waltham Chase, and Wickham.
1997–present: As above less the City of Winchester wards.
The constituency comprises all wards of the Fareham borough except Stubbington and Hill Head. The largest town in the constituency, as the name suggests, is Fareham. Other communities in the constituency include Portchester, Locks Heath, Warsash and Titchfield.
History
The constituency was first created in 1885, however in 1950 it was abolished to form the constituency of Gosport and Fareham. It was revived again in 1974. The constituency has always been represented by Conservatives.
Members of Parliament
MPs 1885–1950
| Election | Member[2] | Party | |
|---|---|---|---|
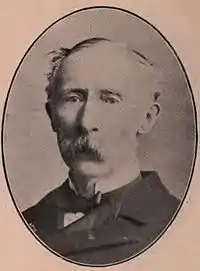
| 1885 | Sir Frederick Fitzwygram | Conservative | |
| 1900 | Arthur Lee | Conservative | |
| 1918 | John Davidson | Conservative | |
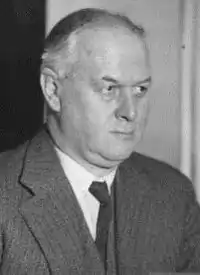
| 1931 by-election | Thomas Inskip | Conservative | |
| 1939 by-election | Dymoke White | Conservative | |
| 1950 | constituency abolished: see Gosport and Fareham | ||
MPs since 1974
| Election | Member[2] | Party | |
|---|---|---|---|
| Feb. 1974 | Reginald Bennett | Conservative | |
| 1979 | Sir Peter Lloyd | Conservative | |
| 2001 | Mark Hoban | Conservative | |
| 2015 | Suella Braverman | Conservative | |
Elections
Elections in the 2010s
| Party | Candidate | Votes | % | ±% | |
|---|---|---|---|---|---|
| Conservative | Suella Braverman | 36,459 | 63.7 | +0.7 | |
| Labour | Matthew Randall | 10,373 | 18.1 | -7.1 | |
| Liberal Democrats | Matthew Winnington | 8,006 | 14.0 | +7.2 | |
| Green | Nick Lyle | 2,412 | 4.2 | +1.9 | |
| Majority | 26,086 | 45.6 | +7.8 | ||
| Turnout | 57,250 | 73.1 | +0.8 | ||
| Conservative hold | Swing | +3.9 | |||
| Party | Candidate | Votes | % | ±% | |
|---|---|---|---|---|---|
| Conservative | Suella Fernandes | 35,915 | 63.0 | +6.9 | |
| Labour | Matthew Randall | 14,360 | 25.2 | +10.9 | |
| Liberal Democrats | Matthew Winnington | 3,896 | 6.8 | -2.0 | |
| UKIP | Tony Blewett | 1,541 | 2.7 | -12.7 | |
| Green | Miles Grindey | 1,302 | 2.3 | -1.6 | |
| Majority | 21,555 | 37.8 | -2.9 | ||
| Turnout | 57,014 | 72.3 | +1.5 | ||
| Conservative hold | Swing | -2.0 | |||
| Party | Candidate | Votes | % | ±% | |
|---|---|---|---|---|---|
| Conservative | Suella Fernandes[6] | 30,689 | 56.1 | +0.8 | |
| UKIP | Malcolm Jones[7] | 8,427 | 15.4 | +11.3 | |
| Labour | Stuart Rose[8] | 7,800 | 14.3 | +0.1 | |
| Liberal Democrats | Matthew Winnington[9] | 4,814 | 8.8 | −15.0 | |
| Green | Miles Grindey | 2,129 | 3.9 | +2.4 | |
| Independent | Nick Gregory | 705 | 1.3 | N/A | |
| Independent | Harvey Hines | 136 | 0.2 | N/A | |
| Majority | 22,262 | 40.7 | +9.2 | ||
| Turnout | 54,700 | 70.8 | -0.8 | ||
| Conservative hold | Swing | -5.3 | |||
| Party | Candidate | Votes | % | ±% | |
|---|---|---|---|---|---|
| Conservative | Mark Hoban | 30,037 | 55.3 | +5.6 | |
| Liberal Democrats | Alex Bentley | 12,945 | 23.8 | +2.1 | |
| Labour | James Carr | 7,719 | 14.2 | −11.4 | |
| UKIP | Steve Richards | 2,235 | 4.1 | +1.2 | |
| Green | Peter Doggett | 791 | 1.5 | N/A | |
| English Democrat | Joe Jenkins | 618 | 1.1 | N/A | |
| Majority | 17,092 | 31.5 | +7.4 | ||
| Turnout | 54,345 | 71.6 | +4.7 | ||
| Conservative hold | Swing | +1.7 | |||
Elections in the 2000s
| Party | Candidate | Votes | % | ±% | |
|---|---|---|---|---|---|
| Conservative | Mark Hoban | 24,151 | 49.7 | +2.6 | |
| Labour | James Carr | 12,449 | 25.6 | −6.0 | |
| Liberal Democrats | Richard de Ste-Croix | 10,551 | 21.7 | +3.0 | |
| UKIP | Peter Mason-Apps | 1,425 | 2.9 | +0.3 | |
| Majority | 11,702 | 24.1 | +8.7 | ||
| Turnout | 48,576 | 66.9 | +3.4 | ||
| Conservative hold | Swing | +4.3 | |||
| Party | Candidate | Votes | % | ±% | |
|---|---|---|---|---|---|
| Conservative | Mark Hoban | 21,389 | 47.1 | +0.3 | |
| Labour | James Carr | 14,380 | 31.6 | +4.6 | |
| Liberal Democrats | Hugh Pritchard | 8,503 | 18.7 | −0.9 | |
| UKIP | William O’Brien | 1,175 | 2.6 | N/A | |
| Majority | 7,009 | 15.4 | −4.4 | ||
| Turnout | 45,447 | 63.5 | −3.4 | ||
| Conservative hold | Swing | ||||
Elections in the 1990s
| Party | Candidate | Votes | % | ±% | |
|---|---|---|---|---|---|
| Conservative | Peter Lloyd | 24,436 | 46.8 | −14.2 | |
| Labour | Michael A. Prior | 14,078 | 27.0 | +13.8 | |
| Liberal Democrats | Grace Hill | 10,234 | 19.6 | −5.0 | |
| Referendum | Dayne Markham | 2,914 | 5.6 | +5.6 | |
| No to Europe | William O'Brien | 515 | 1.0 | N/A | |
| Majority | 10,358 | 19.8 | −16.6 | ||
| Turnout | 48,576 | 66.9 | +3.4 | ||
| Conservative hold | Swing | ||||
| Party | Candidate | Votes | % | ±% | |
|---|---|---|---|---|---|
| Conservative | Peter Lloyd | 40,482 | 61.0 | −0.1 | |
| Liberal Democrats | John C. Thompson | 16,341 | 24.6 | −5.3 | |
| Labour | Elizabeth M. Weston | 8,766 | 13.2 | +4.1 | |
| Green | Malcolm J. Brimecome | 818 | 1.2 | N/A | |
| Majority | 24,141 | 36.4 | +5.1 | ||
| Turnout | 66,407 | 81.9 | +3.4 | ||
| Conservative hold | Swing | +2.6 | |||
Elections in the 1980s
| Party | Candidate | Votes | % | ±% | |
|---|---|---|---|---|---|
| Conservative | Peter Lloyd | 36,781 | 61.1 | −0.7 | |
| Liberal | Timothy Slack | 17,986 | 29.9 | −1.1 | |
| Labour | Michael Merritt | 5,451 | 9.0 | +1.8 | |
| Majority | 18,795 | 31.2 | |||
| Turnout | 60,218 | 78.4 | |||
| Conservative hold | Swing | ||||
| Party | Candidate | Votes | % | ±% | |
|---|---|---|---|---|---|
| Conservative | Peter Lloyd | 32,762 | 61.8 | ||
| Liberal | Steve Yolland | 16,446 | 31.0 | ||
| Labour | D. Sommerville | 3,808 | 7.2 | ||
| Majority | 16,316 | 30.8 | |||
| Turnout | 53,016 | 73.7 | |||
| Conservative hold | Swing | ||||
Elections in the 1970s
| Party | Candidate | Votes | % | ±% | |
|---|---|---|---|---|---|
| Conservative | Peter Lloyd | 28,730 | 59.0 | ||
| Liberal | W.P. Boulden | 11,685 | 24.0 | ||
| Labour | B.R. Townsend | 8,041 | 16.5 | ||
| National Front | D.C. Vine | 252 | 0.5 | ||
| Majority | 17,045 | 35.0 | |||
| Turnout | 79.1 | ||||
| Conservative hold | Swing | ||||
| Party | Candidate | Votes | % | ±% | |
|---|---|---|---|---|---|
| Conservative | Reginald Bennett | 19,053 | 43.2 | ||
| Liberal | P. Smith | 14,605 | 33.1 | ||
| Labour | B.R. Townsend | 8,153 | 18.5 | ||
| Ind. Conservative | W.P. Boulden | 1,727 | 3.9 | ||
| National Front | R.M. Doughty | 617 | 1.4 | ||
| Majority | 4,448 | 10.1 | |||
| Turnout | 44,155 | 77.0 | |||
| Conservative hold | Swing | ||||
| Party | Candidate | Votes | % | ±% | |
|---|---|---|---|---|---|
| Conservative | Reginald Bennett | 22,303 | 47.6 | N/A | |
| Liberal | P. Smith | 14,426 | 30.8 | N/A | |
| Labour | J. Horne | 8,237 | 17.6 | N/A | |
| Ind. Conservative | W.P. Boulden | 1,879 | 4.0 | N/A | |
| Majority | 7,877 | 16.8 | N/A | ||
| Turnout | 46,845 | 82.4 | N/A | ||
| Conservative win (new seat) | |||||
Elections in the 1940s
| Party | Candidate | Votes | % | ±% | |
|---|---|---|---|---|---|
| Conservative | Dymoke White | 35,882 | 52.47 | ||
| Labour | Ashley Bramall | 32,501 | 47.53 | ||
| Majority | 3,381 | 4.94 | |||
| Turnout | 70.96 | ||||
| Conservative hold | Swing | ||||
Elections in the 1930s
| Party | Candidate | Votes | % | ±% | |
|---|---|---|---|---|---|
| Conservative | Dymoke White | Unopposed | |||
| Conservative hold | Swing | ||||
| Party | Candidate | Votes | % | ±% | |
|---|---|---|---|---|---|
| Conservative | Thomas Inskip | 31,794 | 75.07 | ||
| Labour | Robert Mack | 10,561 | 24.93 | ||
| Majority | 21,233 | 50.13 | |||
| Turnout | 61.92 | ||||
| Conservative hold | Swing | ||||
| Party | Candidate | Votes | % | ±% | |
|---|---|---|---|---|---|
| Conservative | Thomas Inskip | Unopposed | n/a | n/a | |
| Conservative hold | Swing | n/a | |||
| Party | Candidate | Votes | % | ±% | |
|---|---|---|---|---|---|
| Conservative | Thomas Inskip | 18,749 | 65.6 | ||
| Labour | Arthur James Pearson | 6,312 | 22.1 | ||
| Liberal | Conyngham Peters Cross | 3,517 | 12.3 | ||
| Majority | 12,437 | ||||
| Turnout | 50.3 | ||||
| Conservative hold | Swing | ||||
Elections in the 1920s
| Party | Candidate | Votes | % | ±% | |
|---|---|---|---|---|---|
| Unionist | John Davidson | 19,756 | 54.2 | -21.0 | |
| Liberal | Conyngham Peters Cross | 8,630 | 23.7 | n/a | |
| Labour | Arthur James Pearson | 8,034 | 22.1 | -2.7 | |
| Majority | 11,126 | 30.5 | -19.9 | ||
| Turnout | 68.0 | -0.8 | |||
| Unionist hold | Swing | n/a | |||
| Party | Candidate | Votes | % | ±% | |
|---|---|---|---|---|---|
| Unionist | John Davidson | 19,108 | 75.2 | +5.8 | |
| Labour | Joseph Bowron Baker | 6,304 | 24.8 | -5.8 | |
| Majority | 12,804 | 50.4 | +11.6 | ||
| Turnout | 68.8 | +9.1 | |||
| Unionist hold | Swing | +5.8 | |||
| Party | Candidate | Votes | % | ±% | |
|---|---|---|---|---|---|
| Unionist | John Davidson | 14,787 | 69.4 | -3.7 | |
| Labour | Joseph Bowron Baker | 6,526 | 30.6 | +3.7 | |
| Majority | 8,261 | 38.8 | -7.4 | ||
| Turnout | 59.7 | -7.7 | |||
| Unionist hold | Swing | -3.7 | |||
| Party | Candidate | Votes | % | ±% | |
|---|---|---|---|---|---|
| Unionist | John Davidson | 17,008 | 73.1 | n/a | |
| Labour | C H Hoare | 6,245 | 26.9 | n/a | |
| Majority | 10,763 | 46.2 | n/a | ||
| Turnout | 67.4 | n/a | |||
| Unionist hold | Swing | n/a | |||
Election results 1885-1918
Elections in the 1880s
| Party | Candidate | Votes | % | ±% | |
|---|---|---|---|---|---|
| Conservative | Frederick Fitzwygram | 5,177 | 53.4 | N/A | |
| Liberal | Reginald Garton Wilberforce | 4,518 | 46.6 | N/A | |
| Majority | 659 | 6.8 | N/A | ||
| Turnout | 9,695 | 79.7 | N/A | ||
| Registered electors | 12,162 | ||||
| Conservative win (new seat) | |||||
| Party | Candidate | Votes | % | ±% | |
|---|---|---|---|---|---|
| Conservative | Frederick Fitzwygram | Unopposed | |||
| Conservative hold | |||||
Elections in the 1890s
| Party | Candidate | Votes | % | ±% | |
|---|---|---|---|---|---|
| Conservative | Frederick Fitzwygram | 6,086 | 57.2 | N/A | |
| Liberal | James Grab Niven | 4,547 | 42.8 | N/A | |
| Majority | 1,539 | 14.4 | N/A | ||
| Turnout | 10,633 | 77.0 | N/A | ||
| Registered electors | 13,816 | ||||
| Conservative hold | Swing | N/A | |||
| Party | Candidate | Votes | % | ±% | |
|---|---|---|---|---|---|
| Conservative | Frederick Fitzwygram | Unopposed | |||
| Conservative hold | |||||
Elections in the 1900s
| Party | Candidate | Votes | % | ±% | |
|---|---|---|---|---|---|
| Conservative | Arthur Lee | 7,375 | 65.8 | N/A | |
| Liberal | Robert Tweedy-Smith | 3,828 | 34.2 | N/A | |
| Majority | 3,547 | 31.6 | N/A | ||
| Turnout | 11,203 | 69.8 | N/A | ||
| Registered electors | 16,050 | ||||
| Conservative hold | Swing | N/A | |||
| Party | Candidate | Votes | % | ±% | |
|---|---|---|---|---|---|
| Conservative | Arthur Lee | Unopposed | |||
| Conservative hold | |||||
| Party | Candidate | Votes | % | ±% | |
|---|---|---|---|---|---|
| Conservative | Arthur Lee | 7,683 | 54.8 | −11.0 | |
| Liberal | George Evatt | 6,331 | 45.2 | +11.0 | |
| Majority | 1,352 | 9.6 | −22.0 | ||
| Turnout | 14,014 | 80.5 | +10.7 | ||
| Registered electors | 17,398 | ||||
| Conservative hold | Swing | −11.0 | |||
Elections in the 1910s
| Party | Candidate | Votes | % | ±% | |
|---|---|---|---|---|---|
| Conservative | Arthur Lee | 10,117 | 63.7 | +8.9 | |
| Liberal | John Sandy | 5,763 | 36.3 | −8.9 | |
| Majority | 4,354 | 27.4 | +17.8 | ||
| Turnout | 15880 | 84.9 | +4.4 | ||
| Registered electors | 18,695 | ||||
| Conservative hold | Swing | +8.9 | |||
| Party | Candidate | Votes | % | ±% | |
|---|---|---|---|---|---|
| Conservative | Arthur Lee | Unopposed | |||
| Conservative hold | |||||
General Election 1914/15:
Another General Election was required to take place before the end of 1915. The political parties had been making preparations for an election to take place and by the July 1914, the following candidates had been selected;
- Unionist: Arthur Lee
- Liberal:
| Party | Candidate | Votes | % | ±% | |
|---|---|---|---|---|---|
| Unionist | John Davidson | Unopposed | |||
| Unionist hold | |||||
| Party | Candidate | Votes | % | ±% | |
|---|---|---|---|---|---|
| C | Unionist | John Davidson | Unopposed | ||
| Unionist hold | |||||
| C indicates candidate endorsed by the coalition government. | |||||
Notes and references
- Notes
- A county constituency (for the purposes of election expenses and type of returning officer)
- As with all constituencies, the constituency elects one Member of Parliament (MP) by the first past the post system of election at least every five years.
- References
- "Electorate Figures - Boundary Commission for England". 2011 Electorate Figures. Boundary Commission for England. 4 March 2011. Archived from the original on 6 November 2010. Retrieved 13 March 2011.
- Leigh Rayment's Historical List of MPs – Constituencies beginning with "F"
- https://www.fareham.gov.uk/PDF/about_the_council/elections/StatementOfPersonsNominatedUKPGE2019.pdf
- "Fareham parliamentary constituency". BBC News.
- "Election Data 2015". Electoral Calculus. Archived from the original on 17 October 2015. Retrieved 17 October 2015.
- "Tories pick Suella Fernandes to represent them in Fareham election". Portsmouth News.
- "UKIP announces its contender for Fareham MP". Portsmouth News.
- "Stuart Rose PPC page". Labour Party (UK). Archived from the original on 15 February 2015. Retrieved 14 February 2015.
- "City fighter is choice for Fareham". Liberal Democrats. Archived from the original on 2015-04-02.
- "Election Data 2010". Electoral Calculus. Archived from the original on 26 July 2013. Retrieved 17 October 2015.
- "Election Data 2005". Electoral Calculus. Archived from the original on 15 October 2011. Retrieved 18 October 2015.
- "Election Data 2001". Electoral Calculus. Archived from the original on 15 October 2011. Retrieved 18 October 2015.
- "Election Data 1997". Electoral Calculus. Archived from the original on 15 October 2011. Retrieved 18 October 2015.
- "Election Data 1992". Electoral Calculus. Archived from the original on 15 October 2011. Retrieved 18 October 2015.
- "Politics Resources". Election 1992. Politics Resources. 9 April 1992. Archived from the original on 24 July 2011. Retrieved 2010-12-06.
- "Election Data 1987". Electoral Calculus. Archived from the original on 15 October 2011. Retrieved 18 October 2015.
- "Election Data 1983". Electoral Calculus. Archived from the original on 15 October 2011. Retrieved 18 October 2015.
- Craig, F. W. S. (1983). British parliamentary election results 1918-1949 (3 ed.). Chichester: Parliamentary Research Services. ISBN 0-900178-06-X.
- British Parliamentary Election Results 1885-1918, FWS Craig
- The Liberal Year Book, 1907
- Debrett's House of Commons & Judicial Bench, 1886
- Debrett's House of Commons & Judicial Bench, 1901
- Craig, FWS, ed. (1974). British Parliamentary Election Results: 1885-1918. London: Macmillan Press. ISBN 9781349022984.
- Debrett's House of Commons & Judicial Bench, 1916