Hiniduma Polling Division
The Hiniduma Polling Division is a Polling Division in the Galle Electoral District, in the Southern Province, Sri Lanka.
Hiniduma | |
|---|---|
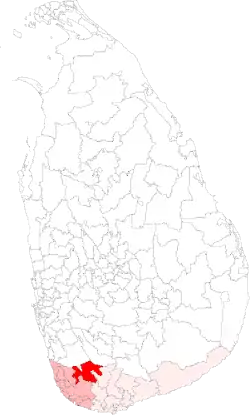 | |
| Coordinates: 6.309662°N 80.347707°E | |
| Country | Sri Lanka |
| Province | Southern Province, Sri Lanka |
| Electoral District | Galle Electoral District |
| Area | |
| • Total | 442.46 km2 (170.83 sq mi) |
| Population (2012)[1] | |
| • Total | 96,823 |
| • Density | 219/km2 (570/sq mi) |
| ISO 3166 code | EC-07E |
Presidential Election Results
Summary
The winner of Hiniduma has matched the final country result 6 out of 8 times. Hence, Hiniduma is a Weak Bellwether for Presidential Elections.
| Year | Hiniduma | Galle Electoral District | MAE[2] % | Sri Lanka | MAE[3] % | |||
|---|---|---|---|---|---|---|---|---|
| 2019 | SLPP | SLPP | 1.78% | SLPP | 9.49% | |||
| 2015 | UPFA | UPFA | 1.99% | NDF | 9.89% | |||
| 2010 | UPFA | UPFA | 0.16% | UPFA | 5.56% | |||
| 2005 | UPFA | UPFA | 1.85% | UPFA | 6.21% | |||
| 1999 | PA | PA | 0.28% | PA | 3.59% | |||
| 1994 | PA | PA | 2.74% | PA | 3.77% | |||
| 1988 | SLFP | SLFP | 3.78% | UNP | 3.00% | |||
| 1982 | UNP | UNP | 4.03% | UNP | 2.06% | |||
| Matches/Mean MAE | 6/8 | 6/8 | 2.08% | 8/8 | 5.45% | |||
2019 Sri Lankan Presidential Election
| Party | Hiniduma[4] | Galle Electoral District | Sri Lanka | |||||||
|---|---|---|---|---|---|---|---|---|---|---|
| Votes | % | Votes | % | Votes | % | |||||
| SLPP | 54,299 | 62.66% | 466,148 | 64.26% | 6,924,255 | 52.25% | ||||
| NDF | 28,046 | 32.37% | 217,401 | 29.97% | 5,564,239 | 41.99% | ||||
| NMPP | 2,479 | 2.86% | 27,006 | 3.72% | 418,553 | 3.16% | ||||
| Other Parties (with < 1%) | 1,827 | 2.11% | 14,803 | 2.04% | 345,452 | 2.61% | ||||
| Valid Votes | 86,651 | 99.29% | 725,358 | 99.20% | 13,252,499 | 98.99% | ||||
| Rejected Votes | 624 | 0.71% | 5,878 | 0.80% | 135,452 | 1.01% | ||||
| Total Polled | 87,275 | 87.02% | 731,236 | 85.15% | 13,387,951 | 83.71% | ||||
| Registered Electors | 100,295 | 858,749 | 15,992,568 | |||||||
2015 Sri Lankan Presidential Election
| Party | Hiniduma[5] | Galle Electoral District | Sri Lanka | |||||||
|---|---|---|---|---|---|---|---|---|---|---|
| Votes | % | Votes | % | Votes | % | |||||
| UPFA | 47,464 | 57.58% | 377,126 | 55.64% | 5,768,090 | 47.58% | ||||
| NDF | 34,022 | 41.27% | 293,994 | 43.37% | 6,217,162 | 51.28% | ||||
| Other Parties (with < 1%) | 942 | 1.14% | 6,691 | 0.99% | 138,200 | 1.14% | ||||
| Valid Votes | 82,428 | 99.05% | 677,811 | 99.05% | 12,123,452 | 98.85% | ||||
| Rejected Votes | 790 | 0.95% | 6,516 | 0.95% | 140,925 | 1.15% | ||||
| Total Polled | 83,218 | 82.59% | 684,327 | 80.46% | 12,264,377 | 78.69% | ||||
| Registered Electors | 100,757 | 850,549 | 15,585,942 | |||||||
2010 Sri Lankan Presidential Election
| Party | Hiniduma[6] | Galle Electoral District | Sri Lanka | |||||||
|---|---|---|---|---|---|---|---|---|---|---|
| Votes | % | Votes | % | Votes | % | |||||
| UPFA | 47,987 | 63.60% | 386,971 | 63.69% | 6,015,934 | 57.88% | ||||
| NDF | 26,061 | 34.54% | 211,633 | 34.83% | 4,173,185 | 40.15% | ||||
| Other Parties (with < 1%) | 1,405 | 1.86% | 9,017 | 1.48% | 204,494 | 1.97% | ||||
| Valid Votes | 75,453 | 99.40% | 607,621 | 99.38% | 10,393,613 | 99.03% | ||||
| Rejected Votes | 457 | 0.60% | 3,765 | 0.62% | 101,838 | 0.97% | ||||
| Total Polled | 75,910 | 80.55% | 611,386 | 77.82% | 10,495,451 | 66.70% | ||||
| Registered Electors | 94,245 | 785,663 | 15,734,587 | |||||||
2005 Sri Lankan Presidential Election
| Party | Hiniduma[7] | Galle Electoral District | Sri Lanka | |||||||
|---|---|---|---|---|---|---|---|---|---|---|
| Votes | % | Votes | % | Votes | % | |||||
| UPFA | 42,304 | 56.46% | 347,233 | 58.41% | 4,887,152 | 50.29% | ||||
| UNP | 31,489 | 42.03% | 239,320 | 40.26% | 4,706,366 | 48.43% | ||||
| Other Parties (with < 1%) | 1,136 | 1.52% | 7,915 | 1.33% | 123,521 | 1.27% | ||||
| Valid Votes | 74,929 | 99.13% | 594,468 | 99.08% | 9,717,039 | 98.88% | ||||
| Rejected Votes | 654 | 0.87% | 5,540 | 0.92% | 109,869 | 1.12% | ||||
| Total Polled | 75,583 | 84.78% | 600,008 | 79.86% | 9,826,908 | 69.51% | ||||
| Registered Electors | 89,156 | 751,327 | 14,136,979 | |||||||
1999 Sri Lankan Presidential Election
| Party | Hiniduma[8] | Galle Electoral District | Sri Lanka | |||||||
|---|---|---|---|---|---|---|---|---|---|---|
| Votes | % | Votes | % | Votes | % | |||||
| PA | 35,712 | 54.85% | 281,154 | 54.91% | 4,312,157 | 51.12% | ||||
| UNP | 25,292 | 38.85% | 195,906 | 38.26% | 3,602,748 | 42.71% | ||||
| JVP | 3,183 | 4.89% | 27,257 | 5.32% | 343,927 | 4.08% | ||||
| Other Parties (with < 1%) | 922 | 1.42% | 7,702 | 1.50% | 176,679 | 2.09% | ||||
| Valid Votes | 65,109 | 98.68% | 512,019 | 98.14% | 8,435,754 | 97.69% | ||||
| Rejected Votes | 873 | 1.32% | 9,716 | 1.86% | 199,536 | 2.31% | ||||
| Total Polled | 65,982 | 83.78% | 521,735 | 77.43% | 8,635,290 | 72.17% | ||||
| Registered Electors | 78,752 | 673,785 | 11,965,536 | |||||||
1994 Sri Lankan Presidential Election
| Party | Hiniduma[9] | Galle Electoral District | Sri Lanka | |||||||
|---|---|---|---|---|---|---|---|---|---|---|
| Votes | % | Votes | % | Votes | % | |||||
| PA | 34,003 | 58.59% | 285,398 | 61.40% | 4,709,205 | 62.28% | ||||
| UNP | 23,216 | 40.00% | 173,282 | 37.28% | 2,715,283 | 35.91% | ||||
| Other Parties (with < 1%) | 819 | 1.41% | 6,135 | 1.32% | 137,040 | 1.81% | ||||
| Valid Votes | 58,038 | 98.21% | 464,815 | 98.49% | 7,561,526 | 98.03% | ||||
| Rejected Votes | 1,059 | 1.79% | 7,112 | 1.51% | 151,706 | 1.97% | ||||
| Total Polled | 59,097 | 79.50% | 471,927 | 73.01% | 7,713,232 | 69.12% | ||||
| Registered Electors | 74,337 | 646,373 | 11,158,880 | |||||||
1988 Sri Lankan Presidential Election
| Party | Hiniduma[10] | Galle Electoral District | Sri Lanka | |||||||
|---|---|---|---|---|---|---|---|---|---|---|
| Votes | % | Votes | % | Votes | % | |||||
| SLFP | 22,347 | 49.47% | 148,615 | 53.09% | 2,289,857 | 44.95% | ||||
| UNP | 22,029 | 48.77% | 124,912 | 44.62% | 2,569,199 | 50.43% | ||||
| SLMP | 794 | 1.76% | 6,417 | 2.29% | 235,701 | 4.63% | ||||
| Valid Votes | 45,170 | 98.38% | 279,944 | 98.43% | 5,094,754 | 98.24% | ||||
| Rejected Votes | 745 | 1.62% | 4,461 | 1.57% | 91,499 | 1.76% | ||||
| Total Polled | 45,915 | 70.30% | 284,405 | 49.34% | 5,186,256 | 55.87% | ||||
| Registered Electors | 65,310 | 576,390 | 9,283,143 | |||||||
1982 Sri Lankan Presidential Election
| Party | Hiniduma[11] | Galle Electoral District | Sri Lanka | |||||||
|---|---|---|---|---|---|---|---|---|---|---|
| Votes | % | Votes | % | Votes | % | |||||
| UNP | 27,209 | 55.73% | 211,544 | 50.23% | 3,450,815 | 52.93% | ||||
| SLFP | 19,649 | 40.25% | 180,925 | 42.96% | 2,546,348 | 39.05% | ||||
| JVP | 1,629 | 3.34% | 20,962 | 4.98% | 273,428 | 4.19% | ||||
| Other Parties (with < 1%) | 334 | 0.68% | 7,707 | 1.83% | 249,460 | 3.83% | ||||
| Valid Votes | 48,821 | 98.78% | 421,138 | 98.78% | 6,520,156 | 98.78% | ||||
| Rejected Votes | 605 | 1.22% | 5,198 | 1.22% | 80,470 | 1.22% | ||||
| Total Polled | 49,426 | 86.60% | 426,336 | 81.84% | 6,600,626 | 80.15% | ||||
| Registered Electors | 57,075 | 520,909 | 8,235,358 | |||||||
Parliamentary Election Results
Summary
The winner of Hiniduma has matched the final country result 5 out of 7 times. Hence, Hiniduma is a Weak Bellwether for Parliamentary Elections.
| Year | Hiniduma | Galle Electoral District | MAE[12] % | Sri Lanka | MAE[13] % | |||
|---|---|---|---|---|---|---|---|---|
| 2015 | UPFA | UPFA | 1.46% | UNP | 4.39% | |||
| 2010 | UPFA | UPFA | 1.72% | UPFA | 5.62% | |||
| 2004 | UPFA | UPFA | 1.26% | UPFA | 6.65% | |||
| 2001 | PA | UNP | 0.96% | UNP | 3.62% | |||
| 2000 | PA | PA | 0.94% | PA | 3.00% | |||
| 1994 | PA | PA | 1.27% | PA | 3.64% | |||
| 1989 | UNP | UNP | 2.95% | UNP | 5.43% | |||
| Matches/Mean MAE | 5/7 | 6/7 | 1.51% | 7/7 | 4.62% | |||
2015 Sri Lankan Parliamentary Election
| Party | Hiniduma[14] | Galle Electoral District | Sri Lanka | |||||||
|---|---|---|---|---|---|---|---|---|---|---|
| Votes | % | Votes | % | Votes | % | |||||
| UPFA | 39,237 | 51.16% | 312,518 | 50.07% | 4,732,664 | 42.48% | ||||
| UNP | 33,999 | 44.33% | 265,180 | 42.49% | 5,098,916 | 45.77% | ||||
| JVP | 3,020 | 3.94% | 37,778 | 6.05% | 544,154 | 4.88% | ||||
| Other Parties (with < 1%) | 441 | 0.57% | 8,659 | 1.39% | 82,852 | 0.74% | ||||
| Valid Votes | 76,697 | 97.33% | 624,135 | 97.63% | 11,140,333 | 95.35% | ||||
| Rejected Votes | 2,094 | 2.66% | 15,107 | 2.36% | 516,926 | 4.42% | ||||
| Total Polled | 78,800 | 78.21% | 639,318 | 78.00% | 11,684,111 | 77.66% | ||||
| Registered Electors | 100,757 | 819,666 | 15,044,490 | |||||||
2010 Sri Lankan Parliamentary Election
| Party | Hiniduma[15] | Galle Electoral District | Sri Lanka | |||||||
|---|---|---|---|---|---|---|---|---|---|---|
| Votes | % | Votes | % | Votes | % | |||||
| UPFA | 40,083 | 68.26% | 305,307 | 66.17% | 4,846,388 | 60.38% | ||||
| UNP | 15,616 | 26.59% | 120,101 | 26.03% | 2,357,057 | 29.37% | ||||
| DNA | 2,717 | 4.63% | 33,663 | 7.30% | 441,251 | 5.50% | ||||
| Other Parties (with < 1%) | 309 | 0.53% | 2,317 | 0.50% | 32,313 | 0.40% | ||||
| Valid Votes | 58,725 | 94.14% | 461,388 | 95.05% | 8,026,322 | 96.03% | ||||
| Rejected Votes | 3,657 | 5.86% | 24,013 | 4.95% | 581,465 | 6.96% | ||||
| Total Polled | 62,382 | 66.19% | 485,401 | 61.67% | 8,358,246 | 59.29% | ||||
| Registered Electors | 94,245 | 787,139 | 14,097,690 | |||||||
2004 Sri Lankan Parliamentary Election
| Party | Hiniduma[16] | Galle Electoral District | Sri Lanka | |||||||
|---|---|---|---|---|---|---|---|---|---|---|
| Votes | % | Votes | % | Votes | % | |||||
| UPFA | 38,633 | 57.25% | 306,385 | 56.58% | 4,223,126 | 45.70% | ||||
| UNP | 27,440 | 40.66% | 209,399 | 38.67% | 3,486,792 | 37.73% | ||||
| JHU | 1,119 | 1.66% | 22,826 | 4.22% | 552,723 | 5.98% | ||||
| Other Parties (with < 1%) | 291 | 0.43% | 2,901 | 0.54% | 60,066 | 0.65% | ||||
| Valid Votes | 67,483 | 93.92% | 541,511 | 94.69% | 9,241,931 | 94.52% | ||||
| Rejected Votes | 4,371 | 6.08% | 30,380 | 5.31% | 534,452 | 5.47% | ||||
| Total Polled | 71,854 | 83.22% | 571,891 | 79.81% | 9,777,821 | 75.74% | ||||
| Registered Electors | 86,343 | 716,609 | 12,909,631 | |||||||
2001 Sri Lankan Parliamentary Election
| Party | Hiniduma[17] | Galle Electoral District | Sri Lanka | |||||||
|---|---|---|---|---|---|---|---|---|---|---|
| Votes | % | Votes | % | Votes | % | |||||
| PA | 30,151 | 44.68% | 232,931 | 42.98% | 3,330,815 | 37.19% | ||||
| UNP | 29,666 | 43.97% | 238,989 | 44.10% | 4,086,026 | 45.62% | ||||
| JVP | 6,717 | 9.95% | 61,806 | 11.41% | 815,353 | 9.10% | ||||
| Other Parties (with < 1%) | 942 | 1.40% | 8,188 | 1.51% | 143,033 | 1.60% | ||||
| Valid Votes | 67,476 | 95.69% | 541,914 | 95.66% | 8,955,844 | 94.77% | ||||
| Rejected Votes | 3,042 | 4.31% | 24,561 | 4.34% | 494,009 | 5.23% | ||||
| Total Polled | 70,518 | 84.65% | 566,475 | 81.09% | 9,449,878 | 76.03% | ||||
| Registered Electors | 83,302 | 698,558 | 12,428,762 | |||||||
2000 Sri Lankan Parliamentary Election
| Party | Hiniduma[18] | Galle Electoral District | Sri Lanka | |||||||
|---|---|---|---|---|---|---|---|---|---|---|
| Votes | % | Votes | % | Votes | % | |||||
| PA | 34,278 | 51.74% | 264,601 | 50.08% | 3,899,329 | 45.33% | ||||
| UNP | 26,629 | 40.19% | 212,055 | 40.14% | 3,451,765 | 40.12% | ||||
| JVP | 4,493 | 6.78% | 41,620 | 7.88% | 518,725 | 6.03% | ||||
| Other Parties (with < 1%) | 852 | 1.29% | 10,072 | 1.91% | 250,489 | 2.91% | ||||
| Valid Votes | 66,252 | N/A | 528,348 | N/A | 8,602,617 | N/A | ||||
1994 Sri Lankan Parliamentary Election
| Party | Hiniduma[19] | Galle Electoral District | Sri Lanka | |||||||
|---|---|---|---|---|---|---|---|---|---|---|
| Votes | % | Votes | % | Votes | % | |||||
| PA | 33,648 | 55.45% | 277,956 | 56.39% | 3,887,805 | 48.94% | ||||
| UNP | 26,099 | 43.01% | 203,268 | 41.24% | 3,498,370 | 44.04% | ||||
| Other Parties (with < 1%) | 939 | 1.55% | 11,690 | 2.37% | 159,429 | 2.01% | ||||
| Valid Votes | 60,686 | 95.67% | 492,914 | 95.96% | 7,943,688 | 95.20% | ||||
| Rejected Votes | 2,747 | 4.33% | 20,763 | 4.04% | 400,395 | 4.80% | ||||
| Total Polled | 63,433 | 85.33% | 513,677 | 79.57% | 8,344,095 | 74.75% | ||||
| Registered Electors | 74,337 | 645,559 | 11,163,064 | |||||||
1989 Sri Lankan Parliamentary Election
| Party | Hiniduma[20] | Galle Electoral District | Sri Lanka | |||||||
|---|---|---|---|---|---|---|---|---|---|---|
| Votes | % | Votes | % | Votes | % | |||||
| UNP | 25,466 | 52.05% | 183,962 | 50.40% | 2,838,005 | 50.71% | ||||
| SLFP | 22,597 | 46.19% | 152,096 | 41.67% | 1,785,369 | 31.90% | ||||
| Other Parties (with < 1%) | 863 | 1.76% | 28,947 | 7.93% | 502,202 | 8.97% | ||||
| Valid Votes | 48,926 | 94.31% | 365,005 | 93.94% | 5,596,468 | 93.87% | ||||
| Rejected Votes | 2,954 | 5.69% | 23,536 | 6.06% | 365,563 | 6.13% | ||||
| Total Polled | 51,880 | 80.49% | 388,541 | 68.03% | 5,962,031 | 63.60% | ||||
| Registered Electors | 64,452 | 571,146 | 9,374,164 | |||||||
Demographics
Ethnicity
The Hiniduma Polling Division has a Sinhalese majority (95.9%) . In comparison, the Galle Electoral District (which contains the Hiniduma Polling Division) has a Sinhalese majority (94.4%) [1]
References
- "Census of Population and Housing 2012". statistics.gov.lk. Department of Census and Statistics, Sri Lanka. 2012.
- The mean absolute error, between the percentages of votes each party got in Hiniduma and the Galle Electoral District. It is a measure of the difference in voting behaviour between the two regions.
- The mean absolute error, between the percentages of votes each party got in Hiniduma and the country. It is a measure of the difference in voting behaviour between the two regions.
- "2019 Sri Lankan presidential election Results". elections.gov.lk. Election Commission of Sri Lanka. 2019.
- "2015 Sri Lankan presidential election Results". elections.gov.lk. Election Commission of Sri Lanka. 2015.
- "2010 Sri Lankan presidential election Results". elections.gov.lk. Election Commission of Sri Lanka. 2010.
- "2005 Sri Lankan presidential election Results". elections.gov.lk. Election Commission of Sri Lanka. 2005.
- "1999 Sri Lankan presidential election Results". elections.gov.lk. Election Commission of Sri Lanka. 1999.
- "1994 Sri Lankan presidential election Results". elections.gov.lk. Election Commission of Sri Lanka. 1994.
- "1988 Sri Lankan presidential election Results". elections.gov.lk. Election Commission of Sri Lanka. 1988.
- "1982 Sri Lankan presidential election Results". elections.gov.lk. Election Commission of Sri Lanka. 1982.
- The mean absolute error, between the percentages of votes each party got in Hiniduma and the Galle Electoral District. It is a measure of the difference in voting behaviour between the two regions.
- The mean absolute error, between the percentages of votes each party got in Hiniduma and the country. It is a measure of the difference in voting behaviour between the two regions.
- "2015 Sri Lankan parliamentary election Results" (PDF). elections.gov.lk. Election Commission of Sri Lanka. 2015.
- "2010 Sri Lankan parliamentary election Results" (PDF). elections.gov.lk. Election Commission of Sri Lanka. 2010.
- "2004 Sri Lankan parliamentary election Results" (PDF). elections.gov.lk. Election Commission of Sri Lanka. 2004.
- "2001 Sri Lankan parliamentary election Results" (PDF). elections.gov.lk. Election Commission of Sri Lanka. 2001.
- "2000 Sri Lankan parliamentary election Results" (PDF). elections.gov.lk. Election Commission of Sri Lanka. 2000.
- "1994 Sri Lankan parliamentary election Results" (PDF). elections.gov.lk. Election Commission of Sri Lanka. 1994.
- "1989 Sri Lankan parliamentary election Results" (PDF). elections.gov.lk. Election Commission of Sri Lanka. 1989.
This article is issued from Wikipedia. The text is licensed under Creative Commons - Attribution - Sharealike. Additional terms may apply for the media files.