Idaho's 1st congressional district
Idaho's 1st congressional district is one of two congressional districts in the U.S. state of Idaho. It comprises the western portion of the state.
| Idaho's 1st congressional district | |||
|---|---|---|---|
.tif.jpg.webp) Idaho's 1st congressional district since January 3, 2013 | |||
| Representative |
| ||
| Distribution |
| ||
| Population (2019) | 934,826 | ||
| Median household income | $62,886[1] | ||
| Ethnicity | |||
| Cook PVI | R+21[3] | ||
From statehood in 1890 to the 1910 election, Idaho was represented by a statewide at-large seat. Following the 1910 census, Idaho gained a second House seat; it was first contested in 1912. However, through the 1916 election, both seats were statewide at-large seats. The first election in Idaho with two congressional districts was in 1918.
The 2012 election cycle saw the district remain largely in the shape it has had since the 1950s, encompassing the western third of the state. Historically, it has been reckoned as the Boise district, as it usually included most of the state capital. The latest round of redistricting, however, saw the 1st pushed to the west, shifting almost all of its share of Boise to the 2nd district.[4] A significant increase in population directly west of Boise over the previous decade, in western Ada and Canyon counties, was responsible for the westward shift of the boundary. However, the 1st continues to include most of Boise's suburbs. In Ada County itself, the district continues to include Meridian, Eagle, Kuna and some parts of Boise south of Interstate 84. It also includes the entire northern portion of the state, through the Panhandle.
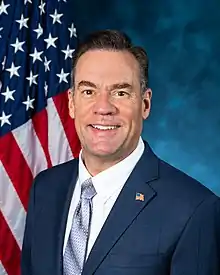
The 1st district is currently represented by Russ Fulcher, a Republican from Boise. First elected in 2018, he defeated Democratic candidate Cristina McNeil and Libertarian candidate W. Scott Howard.
Statewide election results
Presidential election results
Results from previous presidential elections
| Year | Office | Results |
|---|---|---|
| 2000 | President | George W. Bush 64.61% - Al Gore 27.59% |
| 2004 | President | George W. Bush 68.92% - John Kerry 29.53% |
| 2008 | President | John McCain 60.69% - Barack Obama 35.22% |
| 2012 | President | Mitt Romney 64.9% - Barack Obama 32.2% |
| 2016 | President | Donald Trump 63.7% - Hillary Clinton 25.4% |
| 2020 | President | Donald Trump 67.1% - Joe Biden 30.7% |
Non-presidential results
Results from previous non-presidential statewide elections
| Year | Office | Results |
|---|---|---|
| 2016 | Senate | Mike Crapo 68.9% - Jerry Sturgill 25.3% |
| 2018 | Governor | Brad Little 63.5% - Paulette Jordan 34.8% |
| 2018 | Lt. Governor | Janice McGeachin 63.9% - Kristin Collum 36.1% |
| 2018 | Attorney General | Lawrence Wasden 68.7% - Bruce S. Bistline 31.3% |
List of members representing the district
Election results
2002
| Party | Candidate | Votes | % | |
|---|---|---|---|---|
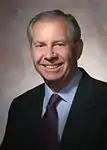
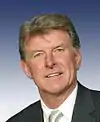
| Republican | Butch Otter (Incumbent) | 120,743 | 58.57 | |
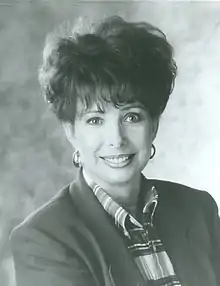
| Democratic | Betty Richardson | 80,269 | 38.94 | |
| Libertarian | Steve Gothard | 5,129 | 2.49 | |
| Total votes | 206,141 | 100.00 | ||
| Turnout | ||||
| Republican hold | ||||
2004
| Party | Candidate | Votes | % | |
|---|---|---|---|---|
| Republican | Butch Otter (Incumbent) | 207,662 | 69.55 | |
| Democratic | Naomi Preston | 90,927 | 30.45 | |
| Total votes | 298,589 | 100.00 | ||
| Turnout | ||||
| Republican hold | ||||
2006
| Party | Candidate | Votes | % | |
|---|---|---|---|---|
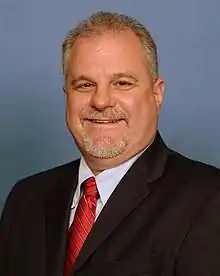
| Republican | Bill Sali (Incumbent) | 115,843 | 49.94 | |
| Democratic | Larry Grant | 103,935 | 44.81 | |
| Independent | Dave Olson | 6,857 | 2.96 | |
| Natural Law | Andy Hedden-Nicely | 2,882 | 1.24 | |
| Constitution | Paul Smith | 2,457 | 1.06 | |
| Total votes | 231,974 | 100.00 | ||
| Turnout | ||||
| Republican hold | ||||
2008
| Party | Candidate | Votes | % | |||
|---|---|---|---|---|---|---|
| Democratic | Walt Minnick | 175,898 | 50.61 | |||
| Republican | Bill Sali (Incumbent) | 171,687 | 49.39 | |||
| Total votes | 347,585 | 100.00 | ||||
| Turnout | ||||||
| Democratic gain from Republican | ||||||
2010
| Party | Candidate | Votes | % | |||
|---|---|---|---|---|---|---|
| Republican | Raúl Labrador | 126,231 | 51.02 | |||
| Democratic | Walt Minnick (Incumbent) | 102,135 | 41.28 | |||
| Independent | Dave Olson | 14,365 | 5.81 | |||
| Libertarian | Mike Washburn | 4,696 | 1.90 | |||
| Total votes | 247,427 | 100.00 | ||||
| Turnout | ||||||
| Republican gain from Democratic | ||||||
2012
| Party | Candidate | Votes | % | |
|---|---|---|---|---|
| Republican | Raúl Labrador | 58,003 | 80.6 | |
| Republican | Reed McCandless | 13,917 | 19.4 | |
| Total votes | 71,920 | 100 | ||
| Party | Candidate | Votes | % | |
|---|---|---|---|---|
| Democratic | Jimmy Farris | 5,362 | 53.2 | |
| Democratic | Cynthia Clinkingbeard | 4,723 | 46.8 | |
| Total votes | 10,085 | 100 | ||
| Party | Candidate | Votes | % | |
|---|---|---|---|---|
| Republican | Raúl Labrador (Incumbent) | 199,402 | 63.0 | |
| Democratic | Jimmy Farris | 97,450 | 30.8 | |
| Libertarian | Rob Oates | 12,265 | 3.9 | |
| Independent | Pro-Life | 7,607 | 2.4 | |
| Total votes | 316,724 | 100.0 | ||
2014
| Party | Candidate | Votes | % | |
|---|---|---|---|---|
| Republican | Raúl Labrador | 56,206 | 78.6 | |
| Republican | Lisa Marie | 5,164 | 7.2 | |
| Republican | Michael Greenway | 3,494 | 4.9 | |
| Republican | Reed McCandless | 3,373 | 4.7 | |
| Republican | Sean Blackwell | 3,304 | 4.6 | |
| Total votes | 71,541 | 100 | ||
| Party | Candidate | Votes | % | |
|---|---|---|---|---|
| Democratic | Shirley Ringo | 9,047 | 82.0 | |
| Democratic | Ryan Barone | 1,981 | 18.0 | |
| Total votes | 11,028 | 100 | ||
| Party | Candidate | Votes | % | |
|---|---|---|---|---|
| Republican | Raúl Labrador (Incumbent) | 143,580 | 65.01 | |
| Democratic | Shirley Ringo | 77,277 | 34.99 | |
| Other | Write-ins | 7 | <0.01 | |
| Majority | 66,303 | 30.02% | ||
| Total votes | 220,864 | 100 | ||
| Republican hold | ||||
2016
| Party | Candidate | Votes | % | |
|---|---|---|---|---|
| Republican | Raúl Labrador | 51,568 | 80.98 | |
| Republican | Gordon Counsil | 6,510 | 10.22 | |
| Republican | Isaac M. Haugen | 5,605 | 8.80 | |
| Total votes | 63,683 | 100 | ||
| Party | Candidate | Votes | % | |
|---|---|---|---|---|
| Democratic | James Piotrowski | 6,954 | 56.15 | |
| Democratic | Shizandra Fox | 3,428 | 27.68 | |
| Democratic | Staniela Nikolova | 2,002 | 16.17 | |
| Total votes | 12,384 | 100 | ||
| Party | Candidate | Votes | % | |
|---|---|---|---|---|
| Republican | Raúl Labrador (Incumbent) | 242,252 | 68.17 | |
| Democratic | James Piotrowski | 113,052 | 31.82 | |
| Other | Write-ins | 53 | 0.01 | |
| Total votes | 355,357 | 100 | ||
| Republican hold | ||||
2018
| Party | Candidate | Votes | % | |
|---|---|---|---|---|
| Republican | Russ Fulcher | 42,793 | 43.1 | |
| Republican | David H. Leroy | 15,451 | 15.6 | |
| Republican | Luke Malek | 14,154 | 14.3 | |
| Republican | Christy Perry | 11,110 | 11.2 | |
| Republican | Michael Snyder | 10,255 | 10.3 | |
| Republican | Alex Gallegos | 3,478 | 3.5 | |
| Republican | Nick Henderson | 2,003 | 2.0 | |
| Total votes | 99,244 | 100.0 | ||
| Party | Candidate | Votes | % | |
|---|---|---|---|---|
| Democratic | Cristina McNeil | 19,070 | 69.3 | |
| Democratic | James Vandermaas | 4,491 | 16.3 | |
| Democratic | Michael Smith | 3,963 | 14.4 | |
| Total votes | 27,524 | 100.0 | ||
| Party | Candidate | Votes | % | |
|---|---|---|---|---|
| Republican | Russ Fulcher | 197,167 | 62.7 | |
| Democratic | Cristina McNeil | 96,932 | 30.8 | |
| Independent | Natalie Fleming | 6,188 | 2.0 | |
| Libertarian | W. Scott Howard | 5,435 | 1.7 | |
| Independent | Paul Farmer | 4,479 | 1.4 | |
| Constitution | Marvin "Pro-Life" Richardson | 3,181 | 1.0 | |
| Independent | Gordon Counsil | 1,054 | 0.3 | |
| Independent | Michael J. Rath (write-in) | 91 | 0.0 | |
| Total votes | 314,527 | 100.0 | ||
| Republican hold | ||||
2020
| Party | Candidate | Votes | % | |
|---|---|---|---|---|
| Republican | Russ Fulcher (incumbent) | 310,736 | 67.8 | |
| Democratic | Rudy Soto | 131,380 | 28.6 | |
| Libertarian | Joe Evans | 16,453 | 3.6 | |
| Total votes | 458,569 | 100.0 | ||
| Republican hold | ||||
Historical district boundaries
References
- "My Congressional District".
- "Census profile: Congressional District 1, ID".
- "Partisan Voting Index – Districts of the 115th Congress" (PDF). The Cook Political Report. April 7, 2017. Retrieved April 7, 2017.
- Adopted Redistricting Plans Archived May 1, 2012, at the Wayback Machine (accessed February 2, 2012)
- "May 15, 2012 Primary Election Results". Secretary of State of Idaho. Retrieved June 11, 2012.
- "2012 General Results statewide". Idaho Secretary of State Election Division. Retrieved March 29, 2013.
- "May 20, 2014 Primary Election Results". Idaho Secretary of State. Retrieved July 17, 2014.
- "Nov 04, 2014 General Election Results". Idaho Secretary of State. Retrieved December 8, 2014.
- "Official Primary Election Statewide Totals". Idaho Secretary of State. Retrieved June 21, 2016.
- "Nov 08, 2016 General Election Results". Idaho Secretary of State. Retrieved December 13, 2016.
External links
- Martis, Kenneth C. (1989). The Historical Atlas of Political Parties in the United States Congress. New York: Macmillan Publishing Company.
- Martis, Kenneth C. (1982). The Historical Atlas of United States Congressional Districts. New York: Macmillan Publishing Company.
- Congressional Biographical Directory of the United States 1774–present