Ille-et-Vilaine's 8th constituency
The 8th constituency of Ille-et-Vilaine is a French legislative constituency in the Ille-et-Vilaine département, mostly in the city of Rennes. Like the other 576 French constituencies, it elects one MP using the two-round system, with a run-off if no candidate receives over 50% of the vote in the first round. It was created when the 2010 redistricting of French legislative constituencies added an 8th constituency to Ille-et-Vilaine.
constituency | |||
 Constituency in department | |||
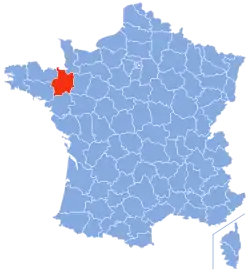 Ille-et-Vilaine in France | |||
| Deputy |
| ||
|---|---|---|---|
| Department | Ille-et-Vilaine | ||
| Cantons | (pre-2015) Mordelles, Rennes-Nord, Rennes-Centre-Ouest, Rennes-Centre, Rennes-Sud-Ouest. | ||
Historic representation
| Election | Member | Party | |
|---|---|---|---|
| 2012 | Marcel Rogemont | PS | |
| 2017 | Florian Bachelier | LREM | |
Election results
2017
| Candidate | Label | First round | Second round | |||
|---|---|---|---|---|---|---|
| Votes | % | Votes | % | |||
| Florian Bachelier | REM | 18,989 | 40.94 | 22,111 | 60.96 | |
| Enora Le Pape | FI | 6,561 | 14.14 | 14,161 | 39.04 | |
| Emmanuel Couet | PS | 6,150 | 13.26 | |||
| Amélie Dhalluin | LR | 5,258 | 11.34 | |||
| Matthieu Theurier | ECO | 3,364 | 7.25 | |||
| Françoise Guillerme | FN | 1,770 | 3.82 | |||
| Claire Payen | PCF | 627 | 1.35 | |||
| Mistral Oz | DIV | 447 | 0.96 | |||
| Thomas Vetel | ECO | 424 | 0.91 | |||
| Sébastien Pirou | DLF | 385 | 0.83 | |||
| Xavier Debroise | DVG | 348 | 0.75 | |||
| Iris Bisson | DIV | 342 | 0.74 | |||
| Gwenvael Jéquel | REG | 324 | 0.70 | |||
| Anne Nadler | DVD | 304 | 0.66 | |||
| Solenn Cochet | DIV | 245 | 0.53 | |||
| Fabrice Lucas | EXG | 239 | 0.52 | |||
| Manon Boucand | ECO | 197 | 0.42 | |||
| Hervé Lejoux | DIV | 172 | 0.37 | |||
| Tugdual Radiguet | ECO | 167 | 0.36 | |||
| Pierre Priet | EXG | 74 | 0.16 | |||
| Votes | 46,387 | 100.00 | 36,272 | 100.00 | ||
| Valid votes | 46,387 | 98.80 | 36,272 | 93.04 | ||
| Blank votes | 371 | 0.79 | 1,991 | 5.11 | ||
| Null votes | 191 | 0.41 | 722 | 1.85 | ||
| Turnout | 46,949 | 56.25 | 38,985 | 46.71 | ||
| Abstentions | 36,520 | 43.75 | 44,484 | 53.29 | ||
| Registered voters | 83,469 | 83,469 | ||||
| Source: Ministry of the Interior[1] | ||||||
2012
| Candidate | Party | First round | Second round | ||||||||
|---|---|---|---|---|---|---|---|---|---|---|---|
| Votes | % | Votes | % | ||||||||
| Marcel Rogemont | PS | 21,484 | 47.85% | 27,460 | 66.11% | ||||||
| Bruno Chavanat | UMP | 11,615 | 25.87% | 14,077 | 33.89% | ||||||
| Matthieu Theurier | EELV | 4,354 | 9.70% | ||||||||
| Denis Kermen | FG | 2,674 | 5.96% | ||||||||
| Cédric Abdilla | FN | 2,513 | 5.60% | ||||||||
| Marie-Noël Convert | CNIP | 471 | 1.05% | ||||||||
| Thomas Vetel | ?? | 448 | 1.00% | ||||||||
| Benoît Evellin | PP | 365 | 0.81% | ||||||||
| Jean-Patrick Muller | NPA | 310 | 0.69% | ||||||||
| Fabrice Lucas | LO | 205 | 0.46% | ||||||||
| Félix Henry | 149 | 0.33% | |||||||||
| Lilian Renault | SP | 144 | 0.32% | ||||||||
| Gérard Monnier | POI | 135 | 0.30% | ||||||||
| Céline Lechevalier | AdOC | 31 | 0.07% | ||||||||
| Valid votes | 44,898 | 98.68% | 41,537 | 97.21% | |||||||
| Spoilt and null votes | 602 | 1.32% | 1,192 | 2.79% | |||||||
| Votes cast / turnout | 45,500 | 57.63% | 42,729 | 54.12% | |||||||
| Abstentions | 33,453 | 42.37% | 36,221 | 45.88% | |||||||
| Registered voters | 78,953 | 100.00% | 78,950 | 100.00% | |||||||
References
- "Résultats des élections législatives 2017" [Results of 2017 Legislative Election] (in French). Ministry of the Interior.
- "Résultats des élections législatives 2012" [Results of 2012 Legislative Election] (in French). Ministry of the Interior.
This article is issued from Wikipedia. The text is licensed under Creative Commons - Attribution - Sharealike. Additional terms may apply for the media files.