Landes's 2nd constituency
The 2nd constituency of the Landes (French: Deuxième circonscription des Landes) is a French legislative constituency in the Landes département. Like the other 576 French constituencies, it elects one MP using the two-round system, with a run-off if no candidate receives over 50% of the vote in the first round.
constituency | |||
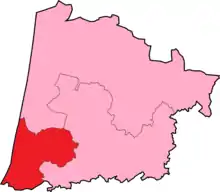
 Landes's 2nd Constituency shown within Landes. | |||
| Deputy |
| ||
|---|---|---|---|
| Department | Landes | ||
| Cantons | (pre-2015) Dax-Nord, Dax-Sud, Saint-Martin-de-Seignanx, Saint-Vincent-de-Tyrosse, Soustons | ||
| Registered voters | 120071 [2] | ||
Description
The 2nd constituency of the Landes lies in the south of the department bordering the Atlantic Ocean to the west and Pyrénées-Atlantiques to the south. As well as a long stretch of coastline the seat also includes the spa town and Subprefecture Dax.
Politically the constituency has traditionally supported the Socialist Party (France) with the exceptions of the 1993 and 2017 elections.
Assembly Members
| Election | Member | Party | |
|---|---|---|---|
| 1988 | Jean-Pierre Pénicaut | PS | |
| 1993 | Henri Lalanne | UDF | |
| 1997 | Jean-Pierre Dufau | PS | |
| 2002 | |||
| 2007 | |||
| 2012 | |||
| 2017 | Lionel Causse | LREM | |
Election Results
2017
| Candidate | Label | First round | Second round | |||
|---|---|---|---|---|---|---|
| Votes | % | Votes | % | |||
| Lionel Causse | REM | 25,414 | 42.96 | 29,682 | 62.95 | |
| Caroline Dacharry | FI | 6,960 | 11.77 | 17,471 | 37.05 | |
| Sylviane Pacot | LR | 6,433 | 10.87 | |||
| Christine Basly-Lapègue | PS | 6,163 | 10.42 | |||
| Francis Garcia | FN | 5,742 | 9.71 | |||
| Jean-Marc Lespade | PCF | 3,881 | 6.56 | |||
| Marie-Ange Delavenne | ECO | 2,078 | 3.51 | |||
| Jean-Pierre Pourrut | DLF | 1,159 | 1.96 | |||
| Didier Tousis | DVG | 514 | 0.87 | |||
| Éric Lavit | DIV | 420 | 0.71 | |||
| Pascal Castéra | EXG | 394 | 0.67 | |||
| Votes | 59,158 | 100.00 | 47,153 | 100.00 | ||
| Valid votes | 59,158 | 97.48 | 47,153 | 90.16 | ||
| Blank votes | 1,080 | 1.78 | 3,454 | 6.60 | ||
| Null votes | 447 | 0.74 | 1,690 | 3.23 | ||
| Turnout | 60,685 | 54.05 | 52,297 | 46.58 | ||
| Abstentions | 51,594 | 45.95 | 59,976 | 53.42 | ||
| Registered voters | 112,279 | 112,273 | ||||
| Source: Ministry of the Interior[3] | ||||||
2012
| Candidate | Party | First round | Second round | ||||||||
|---|---|---|---|---|---|---|---|---|---|---|---|
| Votes | % | Votes | % | ||||||||
| Jean-Pierre Dufau | PS | 27,501 | 44.37% | 34,840 | 60.75% | ||||||
| Julien Dubois | UMP | 16,065 | 25.92% | 22,513 | 39.25% | ||||||
| Jean-Marc Lespade | FG | 6,551 | 10.57% | ||||||||
| Laurence Monteil | FN | 6,376 | 10.29% | ||||||||
| Alain Godot | EELV | 1,926 | 3.11% | ||||||||
| Philippe Mouhel | MoDem | 1,480 | 2.39% | ||||||||
| Jean-Pierre Pourrut | DLR | 861 | 1.39% | ||||||||
| Michel Lefebvre | AEI | 433 | 0.70% | ||||||||
| Pascal Castera | LO | 276 | 0.45% | ||||||||
| Daniel Minvielle | NPA | 260 | 0.42% | ||||||||
| Mélanie Bosquet | ?? | 254 | 0.41% | ||||||||
| Valid votes | 61,983 | 98.03% | 57,353 | 96.04% | |||||||
| Spoilt and null votes | 1,246 | 1.97% | 2,363 | 3.96% | |||||||
| Votes cast / turnout | 63,229 | 60.34% | 59,716 | 56.99% | |||||||
| Abstentions | 41,555 | 39.66% | 45,061 | 43.01% | |||||||
| Registered voters | 104,784 | 100.00% | 104,777 | 100.00% | |||||||
References
- "577 Députés - Assemblée nationale". www2.assemblee-nationale.fr.
- "Assemblée nationale : Élections législatives 2002 - Recensement de la population par circonscription". www.assemblee-nationale.fr.
- "Résultats des élections législatives 2017" [Results of 2017 Legislative Election] (in French). Ministry of the Interior.
- "Résultats des élections législatives 2012" [Results of 2012 Legislative Election] (in French). Ministry of the Interior.
This article is issued from Wikipedia. The text is licensed under Creative Commons - Attribution - Sharealike. Additional terms may apply for the media files.