Languyan
Languyan, officially the Municipality of Languyan, is a 1st class municipality in the province of Tawi-Tawi, Philippines. According to the 2015 census, it has a population of 33,494 people. [3]
Languyan | |
|---|---|
| Municipality of Languyan | |
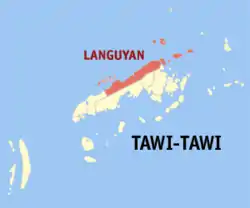 Map of Tawi-Tawi with Languyan highlighted | |
OpenStreetMap 
| |
.svg.png.webp) Languyan Location within the Philippines | |
| Coordinates: 5°16′00″N 120°05′00″E | |
| Country | |
| Region | Bangsamoro Autonomous Region in Muslim Mindanao (BARMM) |
| Province | Tawi-Tawi |
| District | Lone District |
| Barangays | 20 (see Barangays) |
| Government | |
| • Type | Sangguniang Bayan |
| • Mayor | Abduhasan I. Sali |
| • Vice Mayor | Abubashar S. Matba |
| • Representative | Rashidin H. Matba |
| • Electorate | 17,770 voters (2019) |
| Area | |
| • Total | 581.20 km2 (224.40 sq mi) |
| Elevation | 5.0 m (16.4 ft) |
| Highest elevation | 539 m (1,768 ft) |
| Lowest elevation | 0 m (0 ft) |
| Population | |
| • Total | 33,494 |
| • Density | 58/km2 (150/sq mi) |
| • Households | 5,051 |
| Economy | |
| • Income class | 1st municipal income class |
| • Poverty incidence | 22.05% (2015)[4] |
| • Revenue | ₱291,147,479.09 (2016) |
| Service provider | |
| • Electricity | Tawi Tawi Electric Cooperative |
| Time zone | UTC+8 (PST) |
| ZIP code | 7509 |
| PSGC | |
| IDD : area code | +63 (0)68 |
| Climate type | tropical climate |
| Native languages | Sama Tagalog |
| Website | www |
Barangays
Languyan is politically subdivided into 20 barangays.
- Bakong
- Bas-bas Proper
- Basnunuk
- Darussalam
- Languyan Proper (Poblacion)
- Maraning
- Simalak
- Tuhog-Tuhog
- Tumahubong
- Tumbagaan
- Parang Pantay
- Adnin
- Bakaw-bakaw
- BasLikud
- Jakarta (Lookan Latuan)
- Kalupag
- Kiniktal
- Marang-marang
- Sikullis
- Tubig Dakula (Bohe Mahiya)
Climate
| Climate data for Languyan, Tawi-Tawi | |||||||||||||
|---|---|---|---|---|---|---|---|---|---|---|---|---|---|
| Month | Jan | Feb | Mar | Apr | May | Jun | Jul | Aug | Sep | Oct | Nov | Dec | Year |
| Average high °C (°F) | 28 (82) |
28 (82) |
29 (84) |
30 (86) |
29 (84) |
29 (84) |
29 (84) |
29 (84) |
30 (86) |
29 (84) |
29 (84) |
29 (84) |
29 (84) |
| Average low °C (°F) | 24 (75) |
24 (75) |
24 (75) |
24 (75) |
25 (77) |
25 (77) |
24 (75) |
24 (75) |
24 (75) |
25 (77) |
25 (77) |
24 (75) |
24 (76) |
| Average precipitation mm (inches) | 157 (6.2) |
115 (4.5) |
123 (4.8) |
96 (3.8) |
136 (5.4) |
120 (4.7) |
104 (4.1) |
89 (3.5) |
86 (3.4) |
131 (5.2) |
151 (5.9) |
159 (6.3) |
1,467 (57.8) |
| Average rainy days | 20.4 | 17.5 | 20.4 | 21.1 | 26.7 | 25.7 | 26.0 | 24.5 | 24.0 | 27.7 | 26.3 | 24.7 | 285 |
| Source: Meteoblue [5] | |||||||||||||
Demographics
| Year | Pop. | ±% p.a. |
|---|---|---|
| 1980 | 16,269 | — |
| 1990 | 31,984 | +6.99% |
| 1995 | 32,738 | +0.44% |
| 2000 | 42,040 | +5.51% |
| 2007 | 51,377 | +2.80% |
| 2010 | 42,690 | −6.52% |
| 2015 | 33,494 | −4.52% |
| Source: Philippine Statistics Authority [3] [6] [7][8] | ||
Economy
| Poverty Incidence of Languyan | |
| Source: Philippine Statistics Authority[9][10][11][12][13][14] | |
References
- Municipality of Languyan | (DILG)
- "Province: Tawi-tawi". PSGC Interactive. Quezon City, Philippines: Philippine Statistics Authority. Retrieved 12 November 2016.
- Census of Population (2015). "ARMM – Autonomous Region in Muslim Mindanao". Total Population by Province, City, Municipality and Barangay. PSA. Retrieved 20 June 2016.
- https://psa.gov.ph/sites/default/files/City%20and%20Municipal-level%20Small%20Area%20Poverty%20Estimates_%202009%2C%202012%20and%202015_0.xlsx; publication date: 10 July 2019; publisher: Philippine Statistics Authority.
- "Languyan, Tawi-Tawi : Average Temperatures and Rainfall". Meteoblue. Retrieved 30 January 2019.
- Census of Population and Housing (2010). "ARMM – Autonomous Region in Muslim Mindanao". Total Population by Province, City, Municipality and Barangay. NSO. Retrieved 29 June 2016.
- Censuses of Population (1903–2007). "ARMM – Autonomous Region in Muslim Mindanao". Table 1. Population Enumerated in Various Censuses by Province/Highly Urbanized City: 1903 to 2007. NSO.
- "Province of Tawi‑tawi". Municipality Population Data. Local Water Utilities Administration Research Division. Retrieved 17 December 2016.
- "Poverty incidence (PI):". Philippine Statistics Authority. Retrieved 28 December 2020.
- https://psa.gov.ph/sites/default/files/NSCB_LocalPovertyPhilippines_0.pdf; publication date: 29 November 2005; publisher: Philippine Statistics Authority.
- https://psa.gov.ph/sites/default/files/2003%20SAE%20of%20poverty%20%28Full%20Report%29_1.pdf; publication date: 23 March 2009; publisher: Philippine Statistics Authority.
- https://psa.gov.ph/sites/default/files/2006%20and%202009%20City%20and%20Municipal%20Level%20Poverty%20Estimates_0_1.pdf; publication date: 3 August 2012; publisher: Philippine Statistics Authority.
- https://psa.gov.ph/sites/default/files/2012%20Municipal%20and%20City%20Level%20Poverty%20Estima7tes%20Publication%20%281%29.pdf; publication date: 31 May 2016; publisher: Philippine Statistics Authority.
- https://psa.gov.ph/sites/default/files/City%20and%20Municipal-level%20Small%20Area%20Poverty%20Estimates_%202009%2C%202012%20and%202015_0.xlsx; publication date: 10 July 2019; publisher: Philippine Statistics Authority.
External links
Places adjacent to Languyan | ||||||||||
|---|---|---|---|---|---|---|---|---|---|---|
| ||||||||||
Bongao (capital) | |
| Municipalities | |
This article is issued from Wikipedia. The text is licensed under Creative Commons - Attribution - Sharealike. Additional terms may apply for the media files.
