Sapa-Sapa
Sapa-Sapa, officially the Municipality of Sapa-Sapa, is a 3rd class municipality in the province of Tawi-Tawi, Philippines. According to the 2015 census, it has a population of 30,917. [3]
Sapa-Sapa | |
|---|---|
| Municipality of Sapa-Sapa | |
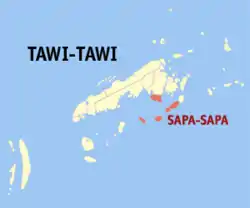 Map of Tawi-Tawi with Sapa-Sapa highlighted | |
OpenStreetMap 
| |
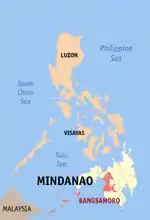
.svg.png.webp) Sapa-Sapa Location within the Philippines | |
| Coordinates: 5°05′24″N 120°16′22″E | |
| Country | |
| Region | Bangsamoro Autonomous Region in Muslim Mindanao (BARMM) |
| Province | Tawi-Tawi |
| District | Lone District |
| Barangays | 23 (see Barangays) |
| Government | |
| • Type | Sangguniang Bayan |
| • Mayor | Rhodesia M. Sali |
| • Vice Mayor | Karim Darwis J. Masdal |
| • Representative | Rashidin H. Matba |
| • Electorate | 14,706 voters (2019) |
| Area | |
| • Total | 235.61 km2 (90.97 sq mi) |
| Elevation | 5.0 m (16.4 ft) |
| Highest elevation | 529 m (1,736 ft) |
| Lowest elevation | 0 m (0 ft) |
| Population | |
| • Total | 30,917 |
| • Density | 130/km2 (340/sq mi) |
| • Households | 4,770 |
| Economy | |
| • Income class | 3rd municipal income class |
| • Poverty incidence | 28.65% (2015)[4] |
| • Revenue | ₱90,914,662.86 (2016) |
| Service provider | |
| • Electricity | Tawi Tawi Electric Cooperative |
| Time zone | UTC+8 (PST) |
| ZIP code | 7503 |
| PSGC | |
| IDD : area code | +63 (0)68 |
| Climate type | tropical climate |
| Native languages | Sama Tagalog |
| Website | www |
Geography
Barangays
Sapa-sapa is politically subdivided into 23 barangays.
- Baldatal
- Butun
- Dalo-Dalo
- Kohek
- Lakit-Lakit
- Latuan (Sunsang)
- Banaran Lookan
- Look Natoh
- Lookan Latuan
- Malanta
- Tambunan
- Sikubong
- Palatih Gadjaminah
- Pamasan
- Sapaat
- Sapa-Sapa (Poblacion)
- Sokah-sokah
- Bukut Sikubong
- Tangngah Deom Sikubong
- Tapian Bohe North
- Tapian Bohe South
- Banaran Tunggusong
- Mantabuan Sannang Hati
- Lookan Tup-Tup
Panampangan Island
Panampangan Island is located in the municipality of Sapa-sapa. The island itself is famous for its sandbar which is considered the longest in the Philippines.
At low tide, the sandbar connects to the nearby islet of Panampangan island.
Climate
| Climate data for Sapa-Sapa, Tawi-Tawi | |||||||||||||
|---|---|---|---|---|---|---|---|---|---|---|---|---|---|
| Month | Jan | Feb | Mar | Apr | May | Jun | Jul | Aug | Sep | Oct | Nov | Dec | Year |
| Average high °C (°F) | 29 (84) |
29 (84) |
29 (84) |
30 (86) |
30 (86) |
30 (86) |
29 (84) |
30 (86) |
30 (86) |
30 (86) |
29 (84) |
29 (84) |
30 (85) |
| Average low °C (°F) | 25 (77) |
24 (75) |
24 (75) |
25 (77) |
25 (77) |
25 (77) |
25 (77) |
25 (77) |
25 (77) |
25 (77) |
25 (77) |
25 (77) |
25 (77) |
| Average precipitation mm (inches) | 157 (6.2) |
115 (4.5) |
123 (4.8) |
96 (3.8) |
136 (5.4) |
120 (4.7) |
104 (4.1) |
89 (3.5) |
86 (3.4) |
131 (5.2) |
151 (5.9) |
159 (6.3) |
1,467 (57.8) |
| Average rainy days | 20.4 | 17.5 | 20.4 | 21.1 | 26.7 | 25.7 | 26.0 | 24.5 | 24.0 | 27.7 | 26.3 | 24.7 | 285 |
| Source: Meteoblue [5] | |||||||||||||
Demographics
| Year | Pop. | ±% p.a. |
|---|---|---|
| 1980 | 14,946 | — |
| 1990 | 16,173 | +0.79% |
| 1995 | 17,728 | +1.73% |
| 2000 | 26,242 | +8.77% |
| 2007 | 37,135 | +4.91% |
| 2010 | 28,781 | −8.86% |
| 2015 | 30,917 | +1.37% |
| Source: Philippine Statistics Authority [3] [6] [7][8] | ||
Economy
| Poverty Incidence of Sapa-Sapa | |
| Source: Philippine Statistics Authority[9][10][11][12][13][14] | |
References
- Municipality of Sapa-Sapa | (DILG)
- "Province: Tawi-tawi". PSGC Interactive. Quezon City, Philippines: Philippine Statistics Authority. Retrieved 12 November 2016.
- Census of Population (2015). "ARMM – Autonomous Region in Muslim Mindanao". Total Population by Province, City, Municipality and Barangay. PSA. Retrieved 20 June 2016.
- https://psa.gov.ph/sites/default/files/City%20and%20Municipal-level%20Small%20Area%20Poverty%20Estimates_%202009%2C%202012%20and%202015_0.xlsx; publication date: 10 July 2019; publisher: Philippine Statistics Authority.
- "Sapa-Sapa, Tawi-Tawi : Average Temperatures and Rainfall". Meteoblue. Retrieved 30 January 2019.
- Census of Population and Housing (2010). "ARMM – Autonomous Region in Muslim Mindanao". Total Population by Province, City, Municipality and Barangay. NSO. Retrieved 29 June 2016.
- Censuses of Population (1903–2007). "ARMM – Autonomous Region in Muslim Mindanao". Table 1. Population Enumerated in Various Censuses by Province/Highly Urbanized City: 1903 to 2007. NSO.
- "Province of Tawi‑tawi". Municipality Population Data. Local Water Utilities Administration Research Division. Retrieved 17 December 2016.
- "Poverty incidence (PI):". Philippine Statistics Authority. Retrieved 28 December 2020.
- https://psa.gov.ph/sites/default/files/NSCB_LocalPovertyPhilippines_0.pdf; publication date: 29 November 2005; publisher: Philippine Statistics Authority.
- https://psa.gov.ph/sites/default/files/2003%20SAE%20of%20poverty%20%28Full%20Report%29_1.pdf; publication date: 23 March 2009; publisher: Philippine Statistics Authority.
- https://psa.gov.ph/sites/default/files/2006%20and%202009%20City%20and%20Municipal%20Level%20Poverty%20Estimates_0_1.pdf; publication date: 3 August 2012; publisher: Philippine Statistics Authority.
- https://psa.gov.ph/sites/default/files/2012%20Municipal%20and%20City%20Level%20Poverty%20Estima7tes%20Publication%20%281%29.pdf; publication date: 31 May 2016; publisher: Philippine Statistics Authority.
- https://psa.gov.ph/sites/default/files/City%20and%20Municipal-level%20Small%20Area%20Poverty%20Estimates_%202009%2C%202012%20and%202015_0.xlsx; publication date: 10 July 2019; publisher: Philippine Statistics Authority.
External links
- Sapa-Sapa Profile at PhilAtlas.com
- Philippine Standard Geographic Code
- Philippine Census Information
Places adjacent to Sapa-Sapa | ||||||||||
|---|---|---|---|---|---|---|---|---|---|---|
| ||||||||||
Bongao (capital) | |
| Municipalities | |
This article is issued from Wikipedia. The text is licensed under Creative Commons - Attribution - Sharealike. Additional terms may apply for the media files.