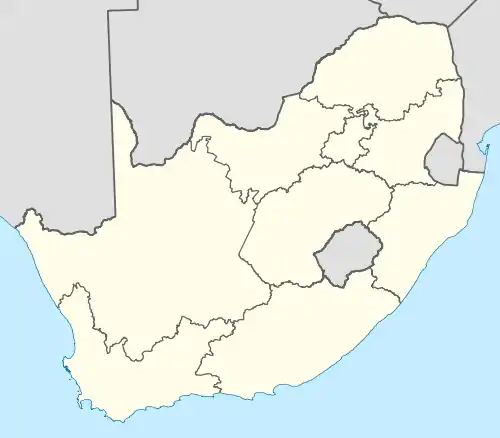
List of South African provinces by population
Since the election of 27 April 1994, South Africa has been divided into nine provinces. They vary widely in population, from the mostly-urban Gauteng, which contains over 20% of the national population, to the mostly-desert Northern Cape, which contains less than 3%. The following table shows the provincial populations according to the 2011 National Census,[1] the 2016 Community Survey,[2] and the most recent mid-year population estimates by Statistics South Africa.[3]
List
| Rank | Province | 2011 census | 2016 community survey | 2020 mid-year estimate | |||
|---|---|---|---|---|---|---|---|
| Population | Percentage | Population | Percentage | Population | Percentage | ||
| 1 | Gauteng | 12,272,263 | 23.7 | 13,399,724 | 24.1 | 15,488,137 | 26.0 |
| 2 | KwaZulu-Natal | 10,267,300 | 19.8 | 11,065,240 | 19.9 | 11,531,628 | 19.3 |
| 3 | Eastern Cape | 6,562,053 | 12.7 | 6,996,976 | 12.6 | 6,734,001 | 11.3 |
| 4 | Western Cape | 5,822,734 | 11.2 | 6,279,730 | 11.3 | 7,055,741 | 11.8 |
| 5 | Limpopo | 5,404,868 | 10.4 | 5,799,090 | 10.4 | 5,852,533 | 9.8 |
| 6 | Mpumalanga | 4,039,939 | 7.8 | 4,335,964 | 7.8 | 4,679,786 | 7.8 |
| 7 | North West | 3,509,953 | 6.8 | 3,748,435 | 6.7 | 4,108,816 | 6.9 |
| 8 | Free State | 2,745,590 | 5.3 | 2,834,714 | 5.1 | 2,928,903 | 4.9 |
| 9 | Northern Cape | 1,145,861 | 2.2 | 1,193,780 | 2.1 | 1,292,786 | 2.2 |
| South Africa | 51,770,561 | 100.0 | 55,653,654 | 100.0 | 59,622,350 | 100.0 | |
Historical data
Since the creation of the current provinces in 1994 there have been three censuses, in 1996, 2001 and 2011.
| Province | Census 1996[4] | Percentage | Census 2001[4] | Percentage | Census 2011 | Percentage |
|---|---|---|---|---|---|---|
| Gauteng | 7,348,423 | 18.1 | 8,837,178 | 19.7 | 12,272,263 | 23.7 |
| KwaZulu-Natal | 8,417,021 | 20.7 | 9,426,017 | 21.0 | 10,267,300 | 19.8 |
| Eastern Cape | 6,302,525 | 15.5 | 6,436,763 | 14.4 | 6,562,053 | 12.7 |
| Western Cape | 3,956,875 | 9.7 | 4,524,335 | 10.1 | 5,822,734 | 11.2 |
| Limpopo | 4,929,368 | 12.1 | 5,273,642 | 11.8 | 5,404,868 | 10.4 |
| Mpumalanga | 2,800,711 | 6.9 | 3,122,990 | 7.0 | 4,039,939 | 7.8 |
| North West | 3,354,825 | 8.3 | 3,669,349 | 8.2 | 3,509,953 | 6.8 |
| Free State | 2,633,504 | 6.5 | 2,706,775 | 6.0 | 2,745,590 | 5.3 |
| Northern Cape | 840,321 | 2.1 | 822,727 | 1.0 | 1,145,861 | 2.2 |
| South Africa | 40,583,573 | 100.0 | 44,819,776 | 100.0 | 51,770,561 | 100.0 |
References
- Census 2011: Census in brief (PDF). Pretoria: Statistics South Africa. 2012. p. 18. ISBN 9780621413885. Archived (PDF) from the original on 13 May 2015.
- Community Survey 2016 in Brief (PDF). Pretoria: Statistics South Africa. 2016. ISBN 9780621449785.
- Mid-year population estimates, 2020 (PDF) (Report). Statistics South Africa. 9 July 2020. p. 16. Retrieved 9 July 2020.
- Census 2001: Census in brief (PDF). Statistics South Africa. 2003. p. 6. ISBN 0-621-34293-9. Archived from the original (PDF) on 5 May 2005. Retrieved 15 January 2011.
This article is issued from Wikipedia. The text is licensed under Creative Commons - Attribution - Sharealike. Additional terms may apply for the media files.
