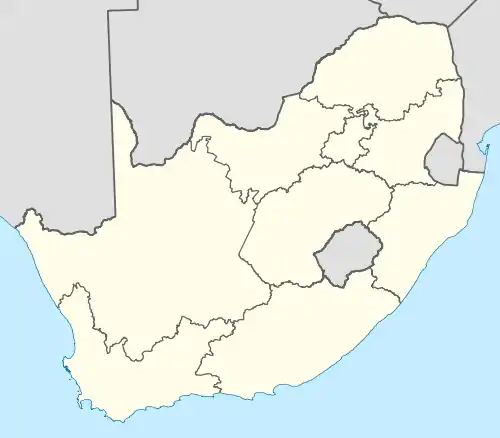
List of South African provinces by gross domestic product
This article lists the provinces of South Africa by their gross regional domestic product (GDP).
| Rank | Province | Percentage | GDP (2013; ZAR millions)[1] | GDP (2013; USD PPP millions)[1] | Equivalent country[2] |
|---|---|---|---|---|---|
| 1 | Gauteng | 33.8 | 1,194,140 | 231,515 | |
| 2 | KwaZulu-Natal | 16.0 | 565,226 | 109,583 | |
| 3 | Western Cape | 13.7 | 485,545 | 94,135 | |
| 4 | Eastern Cape | 7.7 | 272,714 | 52,873 | |
| 5 | Mpumalanga | 7.6 | 269,863 | 52,320 | |
| 6 | Limpopo | 7.3 | 256,896 | 49,806 | |
| 7 | North West | 6.8 | 239,020 | 46,340 | |
| 8 | Free State | 5.1 | 179,776 | 34,854 | |
| 9 | Northern Cape | 2.0 | 71,142 | 13,793 | |
| South Africa | 100.0 | 3,534,330 | 685,219 | ||
References
- Regions and Cities > Regional Statistics > Regional Economy > Regional GDP per Capita, OECD.Stats. Accessed on 16 November 2018.
- "GDP, PPP (current international $) | Data". data.worldbank.org. Retrieved 2018-11-17.
This article is issued from Wikipedia. The text is licensed under Creative Commons - Attribution - Sharealike. Additional terms may apply for the media files.
