Loir-et-Cher's 1st constituency
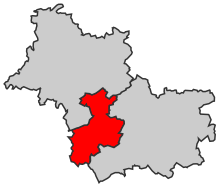
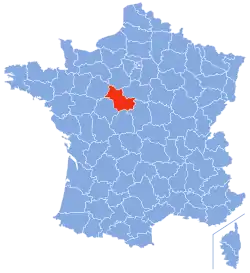
The 1st constituency of the Loir-et-Cher is a French legislative constituency in the Loir-et-Cher département.
constituency | |||
 Constituency in Department | |||
 Loir-et-Cher in France | |||
| Deputy |
| ||
|---|---|---|---|
| Department | Loir-et-Cher | ||
| Cantons | (pre-2015) Blois-1, Blois-2, Blois-3, Blois-4, Blois-5, Contres, Montrichard, Vineuil | ||
| Registered voters | 119,021 | ||
Deputies
| Election | Member | Party | ||
|---|---|---|---|---|
| 1988 | Jack Lang | PS | ||
| 1993 | ||||
| 1997 | ||||
| 2002 | Nicolas Perruchot | UDF | ||
| 2007 | LC | |||
| 2012 | Denys Robiliard | PS | ||
| 2017 | Marc Fesneau | MoDem | Appointed Minister in charge of relations with Parliament and replaced by his substitute (suppléant), Stéphane Baudu, in November 2018 | |
| 2018 | Stéphane Baudu | |||
Election results
2017
| Candidate | Label | First round | Second round | |||
|---|---|---|---|---|---|---|
| Votes | % | Votes | % | |||
| Marc Fesneau | MoDem | 14,076 | 34.59 | 22,914 | 69.15 | |
| Michel Chassier | FN | 6,121 | 15.04 | 10,221 | 30.85 | |
| Denys Robiliard | PS | 5,634 | 13.85 | |||
| Damien Henault | LR | 5,374 | 13.21 | |||
| Kenza Belliard | FI | 4,302 | 10.57 | |||
| Rama Yade | DVD | 2,300 | 5.65 | |||
| Nicolas Orgelet | ECO | 1,148 | 2.82 | |||
| Camélia Khabèche | PCF | 692 | 1.70 | |||
| Étienne Bourgeois | ECO | 447 | 1.10 | |||
| Marie-Claude Neveu | EXG | 320 | 0.79 | |||
| Rémy Meneau | DIV | 275 | 0.68 | |||
| Votes | 40,689 | 100.00 | 33,135 | 100.00 | ||
| Valid votes | 40,689 | 97.96 | 33,135 | 88.84 | ||
| Blank votes | 625 | 1.50 | 3,092 | 8.29 | ||
| Null votes | 221 | 0.53 | 1,071 | 2.87 | ||
| Turnout | 41,535 | 50.19 | 37,298 | 45.07 | ||
| Abstentions | 41,224 | 49.81 | 45,454 | 54.93 | ||
| Registered voters | 82,759 | 82,752 | ||||
| Source: Ministry of the Interior | ||||||
2012
| Candidate | Party | First round | Second round | ||||||||
|---|---|---|---|---|---|---|---|---|---|---|---|
| Votes | % | Votes | % | ||||||||
| Denys Robiliard | PS | 17,278 | 37.27% | 23,972 | 51.90% | ||||||
| Nicolas Perruchot | NC | 16,136 | 34.80% | 22,215 | 48.10% | ||||||
| Michel Chassier | FN | 6,607 | 14.25% | ||||||||
| Laurianne Delaporte | FG | 2,367 | 5.11% | ||||||||
| François Thiollet | EELV | 1,601 | 3.45% | ||||||||
| Elisabeth Montandon | UDN | 539 | 1.16% | ||||||||
| Laurent Guibert | DLR | 446 | 0.96% | ||||||||
| Marie-Anne Clement | NPA | 357 | 0.77% | ||||||||
| Sarah Laurent | ?? | 355 | 0.77% | ||||||||
| Hélène Gilot | MPF | 272 | 0.59% | ||||||||
| Etienne Bourgeois | AEI | 215 | 0.46% | ||||||||
| Alain Lombard | LO | 189 | 0.41% | ||||||||
| Valid votes | 46,362 | 98.54% | 46,187 | 96.85% | |||||||
| Spoilt and null votes | 686 | 1.46% | 1,504 | 3.15% | |||||||
| Votes cast / turnout | 47,048 | 58.45% | 47,691 | 59.25% | |||||||
| Abstentions | 33,442 | 41.55% | 32,804 | 40.75% | |||||||
| Registered voters | 80,490 | 100.00% | 80,495 | 100.00% | |||||||
Sources
- "Résultats électoraux officiels en France" (in French). 2017.
- "Résultats des élections législatives 2012" [Results of 2012 Legislative Election] (in French). Ministry of the Interior.
This article is issued from Wikipedia. The text is licensed under Creative Commons - Attribution - Sharealike. Additional terms may apply for the media files.