Maqên County
Maqên or Maqin County is a county of Qinghai Province, China. It is under the administration of Golog Tibetan Autonomous Prefecture.
Maqên County
玛沁县 · རྨ་ཆེན་རྫོང་། | |
|---|---|
 Peak Amne Machin, the highest peak of the mountain range of the same name | |
.png.webp) Maqên/Maqin County (light red) within Golog Prefecture (yellow) and Qinghai | |
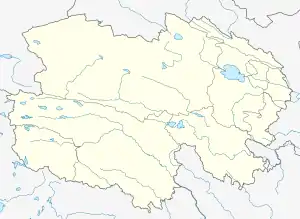 Maqên Location of the county seat in Qinghai | |
| Coordinates (Maqên County government): 34°28′41″N 100°14′20″E | |
| Country | People's Republic of China |
| Province | Qinghai |
| Prefecture | Golog |
| Elevation | 3,700 m (12,140 ft) |
| Time zone | UTC+8 (China Standard) |
| Maqên County | |||||||||
|---|---|---|---|---|---|---|---|---|---|
| Chinese name | |||||||||
| Traditional Chinese | 瑪沁 | ||||||||
| Simplified Chinese | 玛沁 | ||||||||
| |||||||||
| Tibetan name | |||||||||
| Tibetan | རྨ་ཆེན | ||||||||
| |||||||||
Name
The county is named for Anyê Maqên, the Tibetan name for a revered local mountain.
Administrative divisions
Maqên is divided into two towns and six townships:
- Dawu Town (大武镇)
- Lajia Town (拉加镇)
- Dawu Township (大武乡)
- Dongqinggou Township (东倾沟乡)
- Xueshan Township (雪山乡)
- Xiadawu Township (下大武乡)
- Youyun Township (优云乡)
- Dangluo Township (当洛乡)
Climate
Maqên County has an alpine subarctic climate (Köppen Dwc)
| Climate data for Maqên County | |||||||||||||
|---|---|---|---|---|---|---|---|---|---|---|---|---|---|
| Month | Jan | Feb | Mar | Apr | May | Jun | Jul | Aug | Sep | Oct | Nov | Dec | Year |
| Record high °C (°F) | 10.1 (50.2) |
12.8 (55.0) |
17.8 (64.0) |
21.9 (71.4) |
22.5 (72.5) |
24.5 (76.1) |
26.3 (79.3) |
25.1 (77.2) |
25.2 (77.4) |
21.5 (70.7) |
12.8 (55.0) |
10.9 (51.6) |
26.3 (79.3) |
| Average high °C (°F) | −0.5 (31.1) |
1.6 (34.9) |
5.4 (41.7) |
9.5 (49.1) |
12.6 (54.7) |
14.8 (58.6) |
17.0 (62.6) |
17.0 (62.6) |
14.1 (57.4) |
9.1 (48.4) |
4.1 (39.4) |
0.7 (33.3) |
8.8 (47.8) |
| Daily mean °C (°F) | −11.9 (10.6) |
−8.8 (16.2) |
−4.0 (24.8) |
0.9 (33.6) |
5.0 (41.0) |
8.2 (46.8) |
10.2 (50.4) |
9.5 (49.1) |
6.4 (43.5) |
0.9 (33.6) |
−6.3 (20.7) |
−11.1 (12.0) |
−0.1 (31.9) |
| Average low °C (°F) | −21.4 (−6.5) |
−17.7 (0.1) |
−11.6 (11.1) |
−6.2 (20.8) |
−1.3 (29.7) |
2.7 (36.9) |
4.6 (40.3) |
3.6 (38.5) |
1.1 (34.0) |
−4.5 (23.9) |
−13.8 (7.2) |
−20.2 (−4.4) |
−7.1 (19.3) |
| Record low °C (°F) | −33.1 (−27.6) |
−31.9 (−25.4) |
−29.1 (−20.4) |
−20.0 (−4.0) |
−12.8 (9.0) |
−6.0 (21.2) |
−4.0 (24.8) |
−5.5 (22.1) |
−7.5 (18.5) |
−17.8 (0.0) |
−26.6 (−15.9) |
−33.1 (−27.6) |
−33.1 (−27.6) |
| Average precipitation mm (inches) | 2.8 (0.11) |
4.3 (0.17) |
8.2 (0.32) |
19.4 (0.76) |
55.3 (2.18) |
99.4 (3.91) |
115.1 (4.53) |
92.5 (3.64) |
79.5 (3.13) |
32.1 (1.26) |
3.5 (0.14) |
1.6 (0.06) |
513.7 (20.21) |
| Average relative humidity (%) | 53 | 51 | 52 | 56 | 63 | 70 | 73 | 72 | 73 | 67 | 58 | 54 | 62 |
| Source: China Meteorological Administration[1] | |||||||||||||
References
- 中国气象数据网 - WeatherBk Data (in Chinese). China Meteorological Administration. Retrieved 2020-04-16.
This article is issued from Wikipedia. The text is licensed under Creative Commons - Attribution - Sharealike. Additional terms may apply for the media files.
