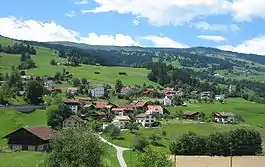
Masein
Masein (Romansh: Masagn) is a municipality in the Viamala Region in the Swiss canton of Graubünden.
Masein | |
|---|---|
 | |
 Coat of arms | |
Location of Masein 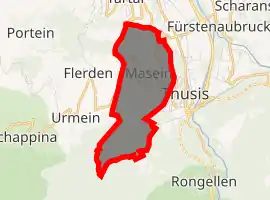
| |
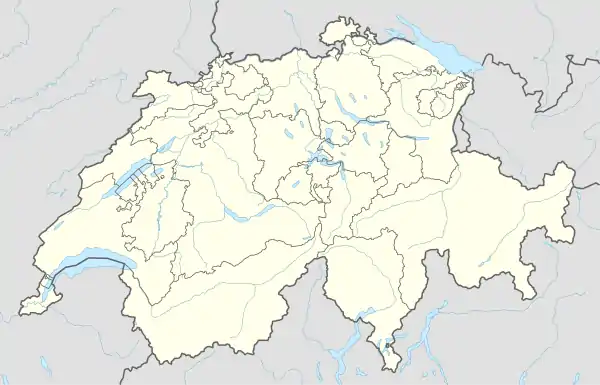 Masein Masein | |
| Coordinates: 46°42′N 9°25′E | |
| Country | Switzerland |
| Canton | Graubünden |
| District | Viamala |
| Area | |
| • Total | 4.2 km2 (1.6 sq mi) |
| Elevation | 865 m (2,838 ft) |
| Population (2018-12-31)[2] | |
| • Total | 488 |
| • Density | 120/km2 (300/sq mi) |
| Time zone | UTC+01:00 (Central European Time) |
| • Summer (DST) | UTC+02:00 (Central European Summer Time) |
| Postal code(s) | 7425 |
| SFOS number | 3663 |
| Surrounded by | Cazis, Flerden, Portein, Tartar, Thusis, Urmein |
| Website | www SFSO statistics |
History
Masein is first mentioned in 1156 as de Medezenu.[3]
Geography
Masein has an area, as of 2006, of 4.2 km2 (1.6 sq mi). Of this area, 38.4% is used for agricultural purposes, while 52% is forested. Of the rest of the land, 6% is settled (buildings or roads) and the remainder (3.6%) is non-productive (rivers, glaciers or mountains).[4]
Before 2017, the municipality was located in the Thusis sub-district, of the Hinterrhein district, after 2017 it was part of the Viamala Region.[5] It is located on the lower Heinzenberg and consists of the two settlements of Ober- and Unter-Masein and the hamlets of Dalaus, Cresta und Lochmüli.
Demographics
Masein has a population (as of 31 December 2019) of 498.[6] As of 2008, 2.8% of the population was made up of foreign nationals. Over the last 10 years the population has grown at a rate of 2.9%.[4]
As of 2000, the gender distribution of the population was 51.0% male and 49.0% female.[7] The age distribution, as of 2000, in Masein is; 46 people or 12.6% of the population are between 0 and 9 years old. 29 people or 7.9% are 10 to 14, and 37 people or 10.1% are 15 to 19. Of the adult population, 38 people or 10.4% of the population are between 20 and 29 years old. 60 people or 16.4% are 30 to 39, 70 people or 19.1% are 40 to 49, and 47 people or 12.8% are 50 to 59. The senior population distribution is 21 people or 5.7% of the population are between 60 and 69 years old, 12 people or 3.3% are 70 to 79, there are 5 people or 1.4% who are 80 to 89, and there is 1 person who is 90 to 99.[8]
In the 2007 federal election the most popular party was the SVP which received 37.7% of the vote. The next three most popular parties were the SPS (33.6%), the FDP (14.8%) and the CVP (11.4%).[4]
The entire Swiss population is generally well educated. In Masein about 80.4% of the population (between age 25-64) have completed either non-mandatory upper secondary education or additional higher education (either university or a Fachhochschule).[4]
Masein has an unemployment rate of 1.21%. As of 2005, there were 32 people employed in the primary economic sector and about 11 businesses involved in this sector. 3 people are employed in the secondary sector and there are 2 businesses in this sector. 47 people are employed in the tertiary sector, with 11 businesses in this sector.[4]
The historical population is given in the following table:[3]
| year | population |
|---|---|
| 1803 | 198 |
| 1850 | 282 |
| 1900 | 228 |
| 1950 | 270 |
| 2000 | 366 |
| 2010 | 409 |
Languages
Most of the population (as of 2000) speaks German (92.6%), with Romansh being second most common ( 3.3%) and Dutch being third ( 1.4%).[4]
| Languages in Masein | ||||||
| Languages | Census 1980 | Census 1990 | Census 2000 | |||
| Number | Percent | Number | Percent | Number | Percent | |
| German | 188 | 82.82% | 306 | 91.89% | 339 | 92.62% |
| Romanish | 26 | 11.45% | 15 | 4.50% | 12 | 3.28% |
| Italian | 6 | 2.64% | 3 | 0.90% | 1 | 0.27% |
| Population | 227 | 100% | 333 | 100% | 366 | 100% |
References
- "Arealstatistik Standard - Gemeinden nach 4 Hauptbereichen". Federal Statistical Office. Retrieved 13 January 2019.
- "Ständige Wohnbevölkerung nach Staatsangehörigkeitskategorie Geschlecht und Gemeinde; Provisorische Jahresergebnisse; 2018". Federal Statistical Office. 9 April 2019. Retrieved 11 April 2019.
- Masein in German, French and Italian in the online Historical Dictionary of Switzerland.
- Swiss Federal Statistical Office Archived 2016-01-05 at the Wayback Machine accessed 7 October 2009
- Swiss Federal Statistical Office - Amtliches Gemeindeverzeichnis der Schweiz - Mutationsmeldungen 2016 accessed 16 February 2017
- "Ständige und nichtständige Wohnbevölkerung nach institutionellen Gliederungen, Geburtsort und Staatsangehörigkeit". bfs.admin.ch (in German). Swiss Federal Statistical Office - STAT-TAB. 31 December 2019. Retrieved 6 October 2020.
- Graubunden in Numbers Archived 2009-09-24 at the Wayback Machine (in German) accessed 21 September 2009
- Graubunden Population Statistics Archived 2009-08-27 at the Wayback Machine (in German) accessed 21 September 2009
| Wikimedia Commons has media related to Masein. |