Mecklenburgische Seenplatte I – Vorpommern-Greifswald II
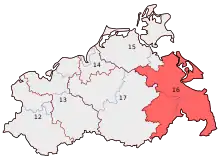
Mecklenburgische Seenplatte I – Vorpommern-Greifswald II is an electoral constituency (German: Wahlkreis) represented in the Bundestag. It elects one member via first-past-the-post voting. Under the current constituency numbering system, it is designated as constituency 16. It is located in southeast Mecklenburg-Vorpommern, comprising the most of the Vorpommern-Greifswald district and southeast parts of the Mecklenburgische Seenplatte district.[1]
| 16 Mecklenburgische Seenplatte I – Vorpommern-Greifswald II | |
|---|---|
| electoral district for the Bundestag | |
 Mecklenburgische Seenplatte I – Vorpommern-Greifswald II in 2013 | |
| State | Mecklenburg-Vorpommern |
| Population | 273,300 (2015) |
| Electorate | 226,039 (2017) |
| Major settlements | Neubrandenburg Anklam |
| Area | 4,950.8 km2 |
| Current electoral district | |
| Created | 2013 |
| Party | CDU |
| Member | Philipp Amthor |
| Elected | 2017 |
Mecklenburgische Seenplatte I – Vorpommern-Greifswald II was created for the 2013 federal election. Since 2017, it has been represented by Philipp Amthor of the Christian Democratic Union (CDU).[2]
Geography
Mecklenburgische Seenplatte I – Vorpommern-Greifswald II is located in southeast Mecklenburg-Vorpommern. As of the 2021 federal election, it comprises all of the Vorpommern-Greifswald district with the exception of municipality of Greifswald and the Amt of Landhagen, as well as the municipalities of Feldberger Seenlandschaft and Neubrandenburg and the Ämter of Friedland, Neverin, Stargarder Land, and Woldegk from the Mecklenburgische Seenplatte district.[1]
History
Mecklenburgische Seenplatte I – Vorpommern-Greifswald II was created in 2013 and contained parts of the abolished constituencies of Greifswald – Demmin – Ostvorpommern and Neubrandenburg – Mecklenburg-Strelitz – Uecker-Randow. Its borders have not changed since its creation.
Members
The constituency was won by the Christian Democratic Union (CDU) in 2013, and represented by Matthias Lietz. He was succeeded by party fellow Philipp Amthor in 2017.
| Election | Member | Party | % | |
|---|---|---|---|---|
| 2013 | Matthias Lietz | CDU | 45.9 | |
| 2017 | Philipp Amthor | CDU | 31.2 | |
Election results
2017 election
| Federal election (2017): Mecklenburgische Seenplatte I – Vorpommern-Greifswald II[3] | |||||||||
|---|---|---|---|---|---|---|---|---|---|
| Notes: |
Blue background denotes the winner of the electorate vote.
| ||||||||
| Party | Candidate | Votes | % | ±% | Party votes | % | ±% | ||
| CDU | Philipp Amthor | 48,269 | 31.2 | 51,789 | 33.5 | ||||
| AfD | Enrico Komning | 36,273 | 23.5 | 35,595 | 23.0 | ||||
| Left | Toni Jaschinski | 29,462 | 19.1 | 27,246 | 17.6 | ||||
| SPD | Heiko Miraß | 21,493 | 13.9 | 19,064 | 12.3 | ||||
| FDP | Christian Bartelt | 8,909 | 5.8 | 8,659 | 5.6 | ||||
| Green | Timo Elias Pfarr | 3,898 | 2.5 | 4,068 | 2.6 | ||||
| NPD | Michael Andrejewski | 2,834 | 1.8 | 3,148 | 2.0 | ||||
| FW | Klaus-Dieter Gabbert | 1,991 | 1.3 | 1,092 | 0.7 | ||||
| Tierschutzpartei | 1,954 | 1.3 | |||||||
| PARTEI | Roland Gorsleben | 1,499 | 1.0 | 1,340 | 0.9 | ||||
| BGE | 548 | 0.3 | |||||||
| MLPD | 169 | 0.1 | |||||||
| ÖDP | 141 | 0.1 | |||||||
| Informal votes | 2,337 | 2,152 | |||||||
| Total Valid votes | 154,628 | 154,813 | |||||||
| Turnout | 156,965 | 69.4 | |||||||
| CDU hold | Majority | 11,996 | 7.7 | ||||||
2013 election
| Federal election (2013): Mecklenburgische Seenplatte I – Vorpommern-Greifswald II[4] | |||||||||
|---|---|---|---|---|---|---|---|---|---|
| Notes: |
Blue background denotes the winner of the electorate vote.
| ||||||||
| Party | Candidate | Votes | % | ±% | Party votes | % | ±% | ||
| CDU | Matthias Lietz | 67,069 | 45.9 | 65,767 | 44.9 | ||||
| Left | Torsten Koplin | 34,972 | 23.9 | 31,658 | 21.6 | ||||
| SPD | Holm-Henning Freier | 22,870 | 15.7 | 21,603 | 14.8 | ||||
| AfD | 8,850 | 6.0 | |||||||
| NPD | Tino Müller | 8,525 | 5.8 | 6,755 | 4.6 | ||||
| Pirates | Uwe Bastian | 3,825 | 2.6 | 2,629 | 1.8 | ||||
| Green | Ralf-Peter Hässelbarth | 3,359 | 2.3 | 4,010 | 2.7 | ||||
| FW | Volker Böhning | 2,781 | 1.9 | 1,523 | 1.0 | ||||
| FDP | Christian Bartelt | 2,695 | 1.8 | 2,910 | 2.0 | ||||
| PRO | 337 | 0.2 | |||||||
| MLPD | 162 | 0.1 | |||||||
| REP | 155 | 0.1 | |||||||
| Informal votes | 2,778 | 2,514 | |||||||
| Total Valid votes | 146,096 | 146,360 | |||||||
| Turnout | 148,874 | 63.6 | |||||||
| CDU win new seat | Majority | 32,097 | 22.0 | ||||||
References
- "Constituency Mecklenburgische Seenplatte I – Vorpommern-Greifswald II". Federal Returning Officer.
- "Results for Mecklenburgische Seenplatte I – Vorpommern-Greifswald II". Federal Returning Officer.
- Results for Mecklenburgische Seenplatte I – Vorpommern-Greifswald II
- Results for Mecklenburgische Seenplatte I – Vorpommern-Greifswald II