Morbihan's 4th constituency
The 4th constituency of Morbihan is a French legislative constituency in the Morbihan département. Like the other 576 French constituencies, it elects one MP using the two-round system, with a run-off if no candidate receives over 50% of the vote in the first round.
constituency | |||
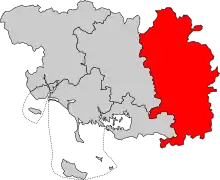 The constituency (red) in Morbihan | |||
| Deputy |
| ||
|---|---|---|---|
| Department | Morbihan | ||
| Cantons | Allaire, La Gacilly, Guer, Josselin, Malestroit, Mauron, Ploërmel, Questembert, Rochefort-en-Terre, La Trinité-Porhoët | ||
Geography
The constituency covers the eastern areas of Morbihan.
Description
At the 2017 election Paul Molac of En Marche! was one of only four candidates elected in the first round.[1]
Historic representation
| Election | Member | Party | |
|---|---|---|---|
| 1988 | Loïc Bouvard | UDF | |
| 2002 | UMP | ||
| 2012 | Paul Molac | DVG | |
| 2017 | LREM | ||
Election results
2017
| Candidate | Label | First round | ||
|---|---|---|---|---|
| Votes | % | |||
| Paul Molac | REM | 30,166 | 54.00 | |
| Marie-Hélène Herry | LR | 8,074 | 14.45 | |
| Cécile Buchet | FI | 6,791 | 12.16 | |
| Agnès Richard | FN | 5,667 | 10.15 | |
| Nathalie Landriau-Berhault | ECO | 2,285 | 4.09 | |
| David Cabas | DLF | 952 | 1.70 | |
| Jean-Louis Amisse | EXG | 638 | 1.14 | |
| Jean-Paul Félix | EXD | 553 | 0.99 | |
| Christine Rault | DIV | 377 | 0.67 | |
| Bernard Huet | DVD | 349 | 0.62 | |
| France Savelli | ECO | 6 | 0.01 | |
| Votes | 55,858 | 100.00 | ||
| Valid votes | 55,858 | 97.91 | ||
| Blank votes | 898 | 1.57 | ||
| Null votes | 293 | 0.51 | ||
| Turnout | 57,049 | 54.28 | ||
| Abstentions | 48,060 | 45.72 | ||
| Registered voters | 105,109 | |||
| Source: Ministry of the Interior | ||||
2012
| Party | Candidate | Votes | % | ±% | |||
|---|---|---|---|---|---|---|---|
| DVG | Paul Molac | 16,142 | 26.14 | ||||
| UMP | François Gueant | 15,896 | 25.74 | ||||
| AC | Jean-Luc Bleher | 9,080 | 14.71 | ||||
| DVG | Charles-Edouard Fichet | 7,891 | 12.78 | ||||
| FN | Jean-Paul Felix | 5,959 | 9.65 | ||||
| MoDem | Michel Guegan | 3,087 | 5.00 | ||||
| FG | Alain Le Guennec | 2,541 | 4.12 | ||||
| Others | N/A | 1,149 | |||||
| Turnout | 61,745 | 60.44 | |||||
| 2nd round result | |||||||
| DVG | Paul Molac | 32,197 | 52.56 | ||||
| UMP | François Gueant | 29,064 | 47.44 | ||||
| Turnout | 61,261 | 59.97 | |||||
| DVG gain from UMP | |||||||
2007
| Party | Candidate | Votes | % | ±% | |
|---|---|---|---|---|---|
| UMP | Loïc Bouvard | 27,351 | 50.42 | ||
| PS | Béatrice Le Marre | 26,893 | 49.58 | ||
| Turnout | 55,744 | 63.90 | |||
| UMP hold | Swing | ||||
Sources
- Official results of French elections from 1998: "Résultats électoraux officiels en France" (in French).
This article is issued from Wikipedia. The text is licensed under Creative Commons - Attribution - Sharealike. Additional terms may apply for the media files.