Payao, Zamboanga Sibugay
Payao, officially the Municipality of Payao (Cebuano: Lungsod sa Payao; Chavacano: Municipalidad de Payao; Tagalog: Bayan ng Payao), is a 3rd class municipality in the province of Zamboanga Sibugay, Philippines. According to the 2015 census, it has a population of 31,686 people. [3]
Payao | |
|---|---|
| Municipality of Payao | |
 Map of Zamboanga Sibugay with Payao highlighted | |
OpenStreetMap 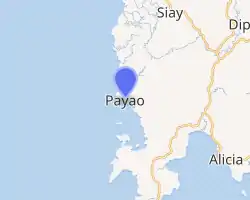
| |
.svg.png.webp) Payao Location within the Philippines | |
| Coordinates: 7°35′09″N 122°48′08″E | |
| Country | |
| Region | Zamboanga Peninsula (Region IX) |
| Province | Zamboanga Sibugay |
| District | 1st District |
| Barangays | 29 (see Barangays) |
| Government | |
| • Type | Sangguniang Bayan |
| • Mayor | Joeper H. Mendoza |
| • Vice Mayor | Joel J. Indino |
| • Representative | Wilter W. Palma II |
| • Electorate | 20,612 voters (2019) |
| Area | |
| • Total | 245.66 km2 (94.85 sq mi) |
| Elevation | 20 m (70 ft) |
| Population | |
| • Total | 31,686 |
| • Density | 130/km2 (330/sq mi) |
| • Households | 6,921 |
| Economy | |
| • Income class | 3rd municipal income class |
| • Poverty incidence | 57.34% (2015)[4] |
| • Revenue | ₱95,251,196.08 (2016) |
| Time zone | UTC+8 (PST) |
| ZIP code | 7008 |
| PSGC | |
| IDD : area code | +63 (0)62 |
| Climate type | tropical climate |
| Native languages | Subanon Cebuano Chavacano Tagalog |
| Website | www |
Barangays
Payao is politically subdivided into 29 barangays.
- Balian
- Balogo
- Balungisan
- Binangonan
- Bulacan
- Bulawan
- Calape
- Dalama
- Fatima (Silal)
- Guintolan
- Guiwan
- Katipunan
- Kima
- Kulasian
- Kulisap
- La Fortuna
- Labatan
- Mayabo (Santa Maria)
- Minundas (Santo. Niño)
- Mountain View (Puluan)
- Nanan
- Poblacion (Payao)
- San Isidro
- San Roque
- San Vicente (Binangonan)
- Silal
- Sumilong
- Talaptap
- Upper Sumilong
Climate
| Climate data for Payao, Zamboanga Sibugay | |||||||||||||
|---|---|---|---|---|---|---|---|---|---|---|---|---|---|
| Month | Jan | Feb | Mar | Apr | May | Jun | Jul | Aug | Sep | Oct | Nov | Dec | Year |
| Average high °C (°F) | 31 (88) |
31 (88) |
31 (88) |
31 (88) |
30 (86) |
29 (84) |
29 (84) |
29 (84) |
29 (84) |
29 (84) |
30 (86) |
30 (86) |
30 (86) |
| Average low °C (°F) | 23 (73) |
23 (73) |
23 (73) |
24 (75) |
25 (77) |
25 (77) |
24 (75) |
24 (75) |
24 (75) |
24 (75) |
24 (75) |
23 (73) |
24 (75) |
| Average precipitation mm (inches) | 61 (2.4) |
55 (2.2) |
75 (3.0) |
81 (3.2) |
145 (5.7) |
189 (7.4) |
189 (7.4) |
197 (7.8) |
162 (6.4) |
181 (7.1) |
115 (4.5) |
70 (2.8) |
1,520 (59.9) |
| Average rainy days | 16.4 | 15.7 | 19.1 | 21.5 | 26.9 | 27.1 | 26.4 | 25.0 | 24.2 | 26.8 | 23.5 | 18.7 | 271.3 |
| Source: Meteoblue [5] | |||||||||||||
Demographics
| Year | Pop. | ±% p.a. |
|---|---|---|
| 1980 | 17,526 | — |
| 1990 | 23,937 | +3.17% |
| 1995 | 25,013 | +0.83% |
| 2000 | 27,036 | +1.68% |
| 2007 | 27,623 | +0.30% |
| 2010 | 29,755 | +2.74% |
| 2015 | 31,686 | +1.20% |
| Source: Philippine Statistics Authority [3] [6] [7][8] | ||
References
- Municipality of Payao | (DILG)
- "Province: Zamboanga Sibugay". PSGC Interactive. Quezon City, Philippines: Philippine Statistics Authority. Retrieved 12 November 2016.
- Census of Population (2015). "Region IX (Zamboanga Peninsula)". Total Population by Province, City, Municipality and Barangay. PSA. Retrieved 20 June 2016.
- "PSA releases the 2015 Municipal and City Level Poverty Estimates". Quezon City, Philippines. Retrieved 12 October 2019.
- "Payao: Average Temperatures and Rainfall". Meteoblue. Retrieved 1 May 2020.
- Census of Population and Housing (2010). "Region IX (Zamboanga Peninsula)". Total Population by Province, City, Municipality and Barangay. NSO. Retrieved 29 June 2016.
- Censuses of Population (1903–2007). "Region IX (Zamboanga Peninsula)". Table 1. Population Enumerated in Various Censuses by Province/Highly Urbanized City: 1903 to 2007. NSO.
- "Province of Zamboanga Sibugay". Municipality Population Data. Local Water Utilities Administration Research Division. Retrieved 17 December 2016.
External links
Places adjacent to Payao, Zamboanga Sibugay | ||||||||||
|---|---|---|---|---|---|---|---|---|---|---|
| ||||||||||
Ipil (capital) | |
| Municipalities | |
This article is issued from Wikipedia. The text is licensed under Creative Commons - Attribution - Sharealike. Additional terms may apply for the media files.